Data Integration, Sharing, and Management for Transportation Planning and Traffic Operations (2025)
Chapter: 8 Use of Waze for Cities Partnership Data for Operations and Planning
CHAPTER 8
Use of Waze for Cities Partnership Data for Operations and Planning
Crowdsourcing, the practice of addressing a need or problem by enlisting the services of many people via technologies, is routinely used by transportation agencies to collect data that inform all types of transportation decisions. Crowdsourced data can be used to enhance agency situational awareness and augment or replace costly traffic monitoring technologies. Crowdsourced data offer low-cost, high-quality operations data, such as traffic speeds and slowdowns, events and crashes, and facility conditions. Transportation system users frequently generate data passively, without any action on their part. They can also generate both quantitative and qualitative data actively by pressing a button on a mobile application (FHWA 2023).
This chapter provides a practical understanding of how state and local transportation agencies can access and use crowdsourced data through the Waze for Cities partnership. Waze offers crowdsourced data free to partner agencies in exchange for data on road closures. The Virginia Department of Transportation (VDOT) developed a brief video about its partnership experience with Waze (VDOT 2021).
The chapter is intended to help agencies learn about the data available through the Waze for Cities partnership and to inform a more robust use strategy for Waze data. The chapter
- Spotlights two transportation agencies that use data from their Waze for Cities partnership;
- Describes how Waze sources and processes data to make information available to its partner agencies as well as the specific data fields and access methods;
- Introduces findings from research and practitioners on the accuracy of the data;
- Delves into considerations before and once becoming a Waze for Cities partner;
- Touches on how and what data agencies can share with Waze;
- Presents the ways agencies have developed tools that ingest Waze data to generate greater value; and
- Summarizes concerns, needs, and future opportunities in the use of Waze data.
The references cited are listed at the end of the chapter.
The chapter draws from published and unpublished discussions, research, and documentation on crowdsourcing for operations from Rounds 5 and 6 of FHWA’s Every Day Counts (EDC)): Innovation for a Nation on the Move. The source material includes reporting from a peer conference at which state and local agencies discussed their experiences in using and integrating crowdsourced data, direct experiences of the FHWA team performing pilot uses of the Waze for Cities data, and other recent research efforts related to the use of crowdsourced data for transportation applications.
Examples of Waze for Cities Partnerships
One example of how transportation agencies can use crowdsourced data to augment and support traffic operations is seen in Lake County, IL. Lake County’s advanced traffic management system (ATMS), Passage, collects data from the law enforcement computer-aided dispatch (CAD) system, crowdsourced Waze data, and construction engineers and then provides information to the traveling public through a highway advisory radio system, email notifications, a website, smartphone apps, Twitter, and portable message signs. Lake County partnered with Waze for Cities after finding Bluetooth sensor data were not sufficiently timely for real-time operations, did not have the geographic coverage the county needed, and had a maintenance cost that was not compatible with its budget. Lake County provides CAD incident and roadwork information to Waze in return. Lake County developed open-source code, called the Travel Time Poller, to archive travel times along more than 600 arterial road segments every few minutes from Waze through the company’s Traffic View interface. The free Waze data, along with investment in staff time and data management resources, offer Lake County a low-cost data option for real-time system operations, incident situational awareness, and broader planning by using archived data (Effinger 2020, Legare 2021).
The city of Louisville, KY, offers a second example of the use of crowdsourced data. The city developed an open-source Waze Analytics Relational-database Platform (WARP) to support data-centered management of traffic and signal operations. Using archives of Waze “jams” data (a measure reflecting the level of congestion), the city developed a visual dashboard to evaluate the effectiveness of signal-timing changes. Figure 8-1 illustrates the density of jams reports prior to signal retiming in an arterial corridor. The city of Louisville also used the Waze jams data and geospatial analyses to plan for and manage special events, identify system hot spots, prioritize investments, detect faulty traffic control and monitoring equipment, and enhance traveler information and communication (FHWA 2020, Schnuerle 2020).
Waze data provide low-cost uses for real-time system operations, incident situational awareness, and system planning using archived data.
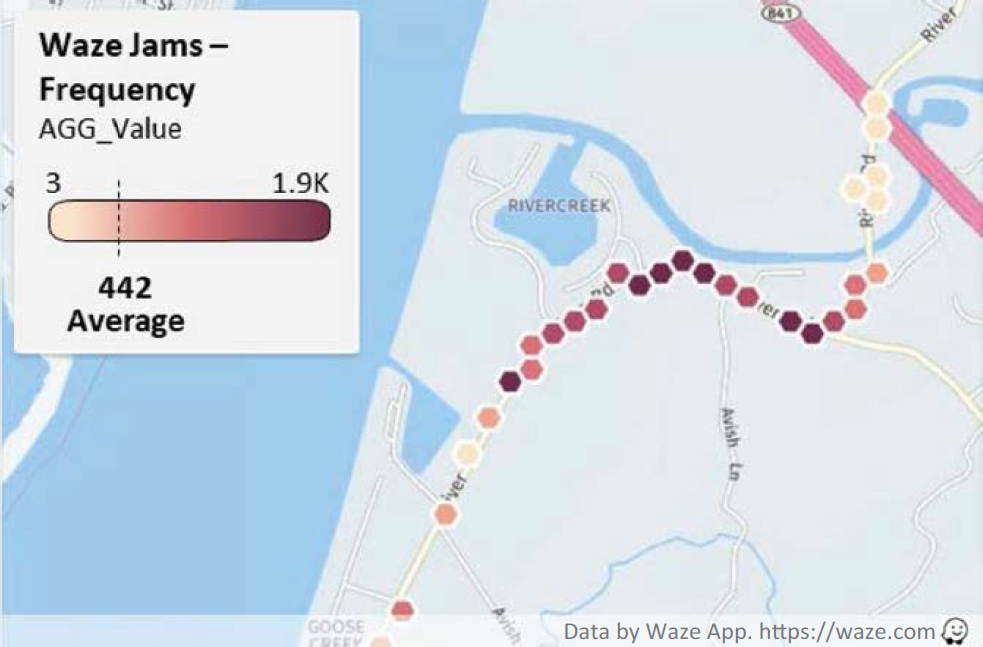
Source: Schnuerle (2020).
Data Description
All users of the Waze mobile navigation app, by agreeing to the terms of use, passively share their Global Positioning System (GPS) location as they use the app during travel. Waze app users often also actively report incidents or other road events through voice prompts or by clicking on the app. Waze also accesses data from Waze for Cities partners. Waze uses proprietary methods to process these data, along with historical data, to provide real-time, anonymous event and congestion information on roadways (Waze n.d.).
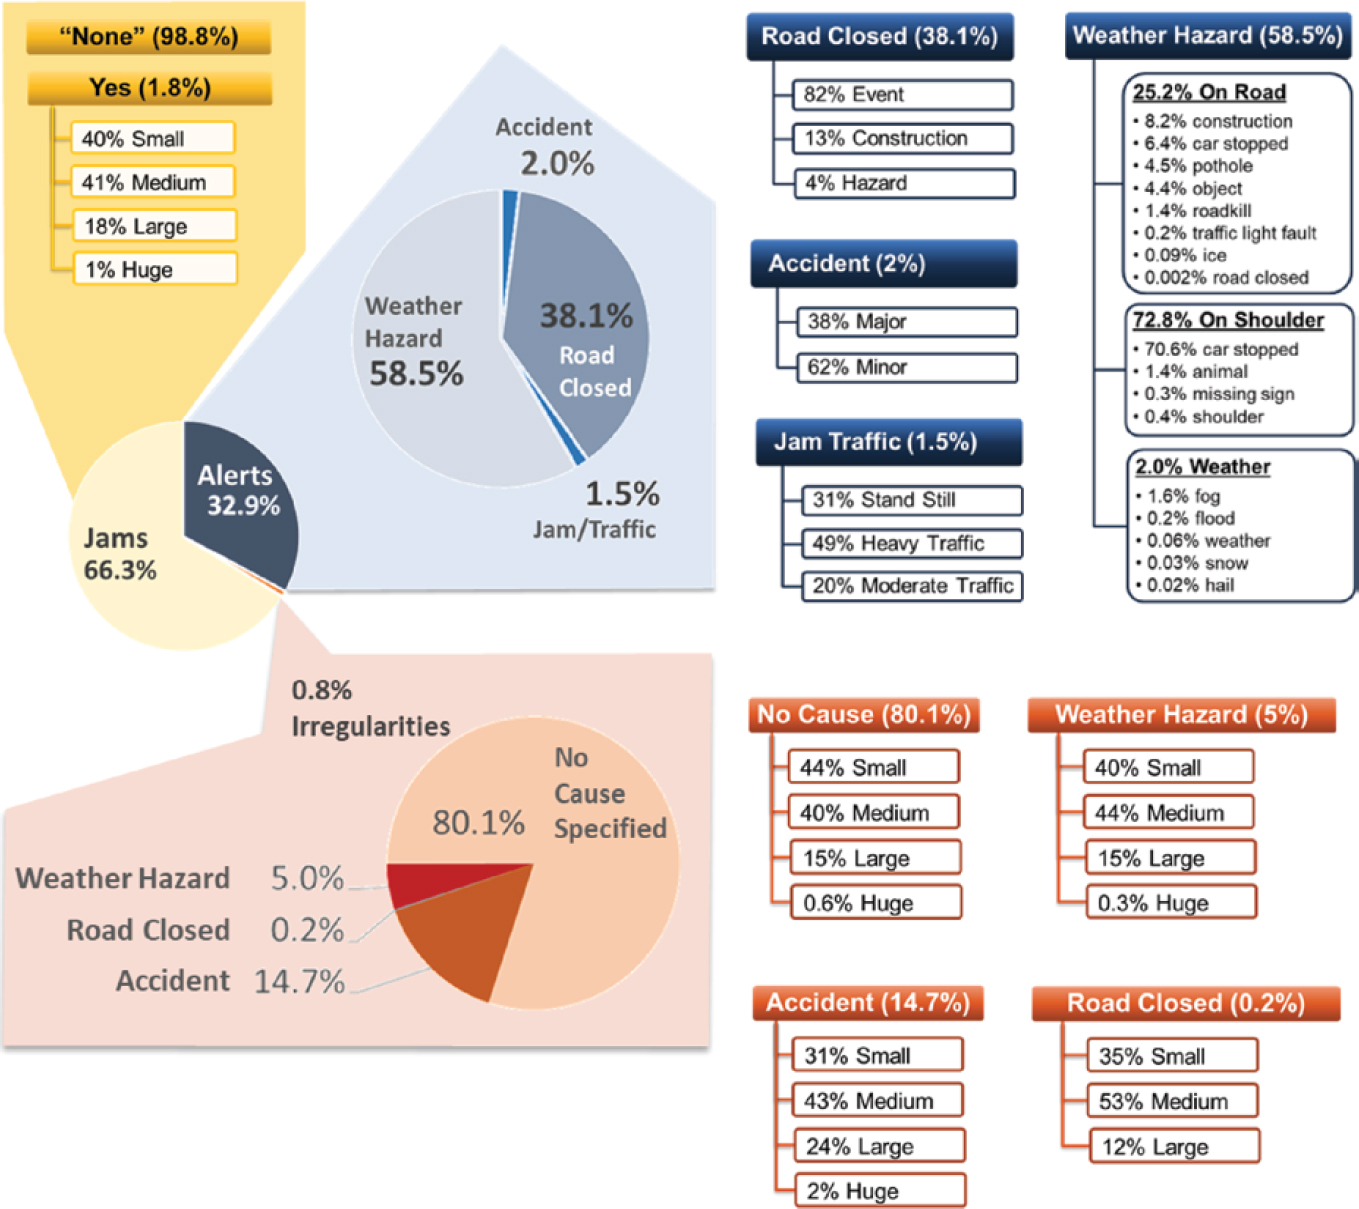
As Waze for Cities partners, agencies define and share a polygon that specifies the geographic area for which they want data access. Some local agencies may choose a polygon that extends beyond the geographic boundaries of the area to capture events in adjacent regions that affect local transportation operations. The Waze data feed includes three types of event data within the geographic boundaries of the prespecified polygon: alerts, irregularities, and jams. Alerts include many categories and subcategories of events reported by Waze users. Jams reflect traffic slowdowns and are based on the passively collected speeds and locations of Waze users. Irregularities reflect a combination of alerts and jams that affect an atypically large number of Waze users. Waze updates the data every 2 minutes and makes it available to partners through a localized XML or JSON GeoRSS feed. Each event includes GPS-based location information as well as confidence and reliability scores. For information on how to get traffic data with the Waze data feed, see https://support.google.com/waze/partners/answer/10618035#zippy=%2Creceiving-incident-data%2Chow-can-i-assess-the-accuracy-of-crowd-sourced-incidents.
Figure 8-2 shows the percentage of events in each of the subcategories drawn from a 2-month archive from one mid-Atlantic state department of transportation (DOT) in 2020. Approximately one-third of the data relates to alerts, while two-thirds relates to jams. As illustrated in Figure 8-2, agencies can view Waze user-reported alerts, such as major or minor accidents (crashes), construction, stopped vehicles, objects on the road, potholes, roadkill, and missing signs. (Note: Waze uses the term “Weather Hazard” to refer to all forms of reports by Waze users.) Not present in these data but available through the Waze feed are multiple other weather hazard subcategories, such as freezing rain, monsoon, or tornado. The jams data may include fields associated with the length, speed, and delay for the jam.
If agencies do not have data storage and analysis capacity for the Waze data in their systems, they can use Waze Google Cloud Integration (https://support.google.com/waze/partners/answer/10715739?hl=en). Cloud Integration includes access to the data warehouse tool BigQuery and the visualization tool Data Studio).
Agencies that are Waze for Cities partners can access the Waze Traffic View tool, a web-based dashboard that provides real-time traffic in the context of historical traffic data and alerts provided by the Waze community (i.e., Waze users and transportation agencies). Traffic View, illustrated in Figure 8-3, allows agencies to view events through a geographic interface. Traffic View includes the Waze-o-Meter (see Figure 8-3, upper left), a color-coded indicator of traffic congestion, and the Unusual Traffic feed, which alerts partners to locations experiencing longer-than-usual drive times and provides a link to alternative route information. The interface also allows partners to specify routes for a watchlist to view travel times for the defined routes. The watchlist is automatically sorted from greatest to least congested. The Traffic View tool does not provide automated archiving of data. Open source code is available to help agencies with this road-segment-specific travel time archiving function.
The Traffic View interface can be used in real time to detect incidents, update control center maps, post travel times on dynamic message signs, and provide traveler information. Waze for Cities partners can also archive data from the watchlist to support before/after traffic studies and broader planning and investment analyses. The Traffic View interface processes both the active and passive real-time data from Waze users along with Waze’s historical data archives.
Data Validation
Data validation is an important consideration in the use of Waze data for operations and planning. Several validation studies have found the speed data to be reliable and the crash data to have relatively little noise when reports are filtered for spatial and temporal proximity to minimize double counting. In the context of Waze alerts, noisy data typically refers to instances of incorrect reports (e.g., report of a stalled vehicle rather than heavy traffic), multiple reports related to a single incident (often from drivers who are only a few hundred feet from each other), or a false report (e.g., a report of a crash when there is none). Several data validation studies are discussed here as examples of the types of validation studies by transportation agencies and their results.
A study of Waze data on traffic speed for a segment of I-40 in Knoxville, TN, compared Waze traffic speed data with remote traffic microwave sensor (RTMS) data over 2 months (Zhang 2020). The findings showed similar patterns between the two datasets, with minor differences at high and low speeds (Figure 8-4). The study also found the Waze speed data to be more reliable during congested times, with more real-time speed observations. As compared with the RTMS data, the Waze data provided more coverage and fewer missing values. The study also compared Tennessee DOT (TDOT) crash records and Waze incident reports in Nashville, TN, in 2018.
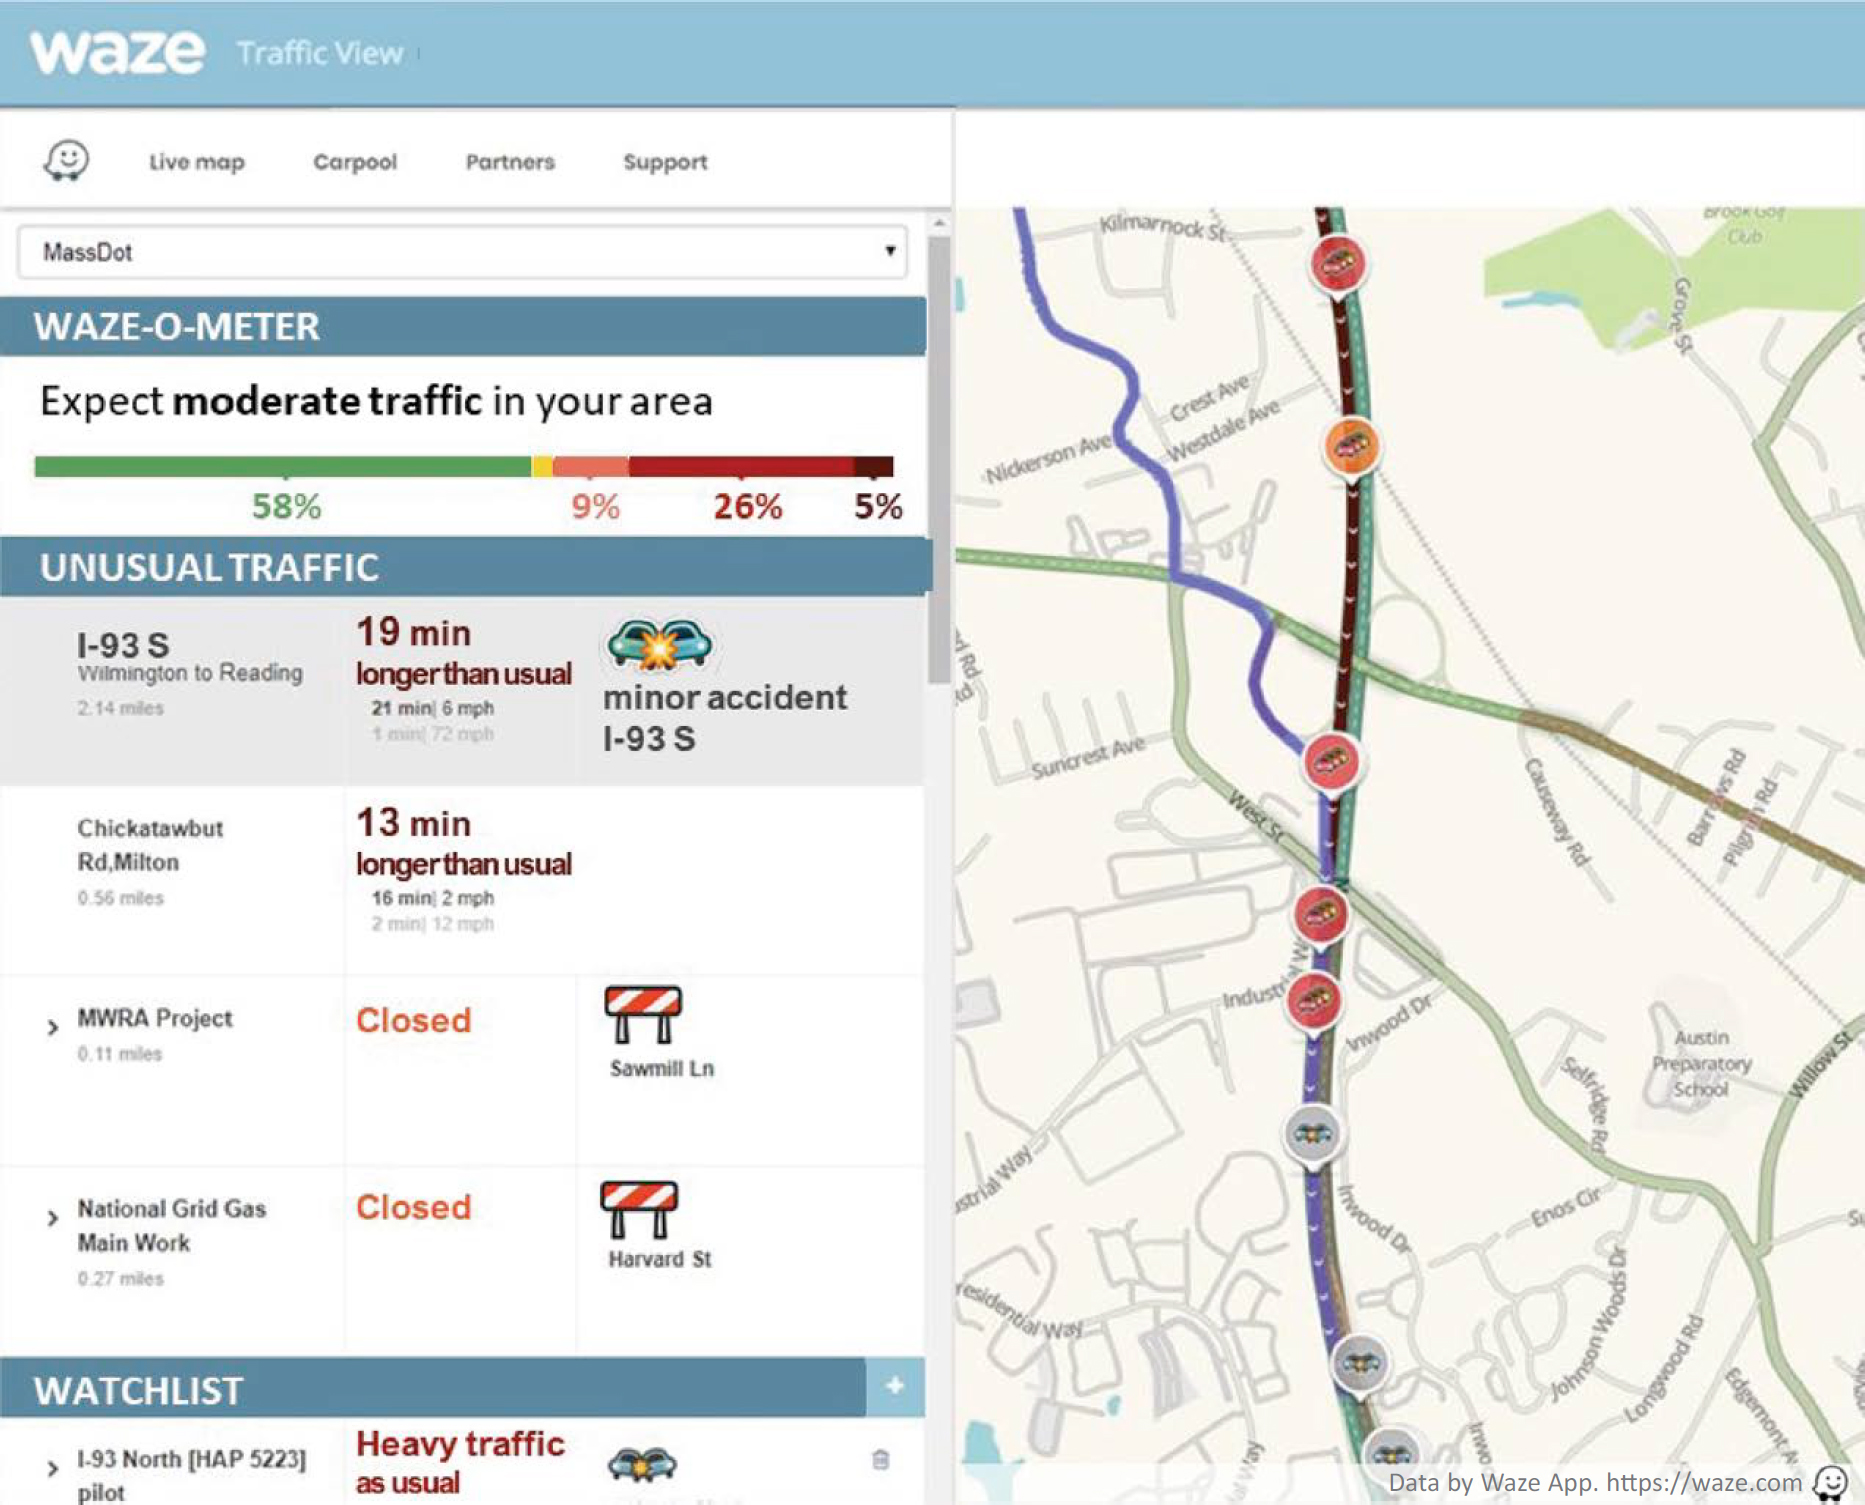
Source: MassDOT.
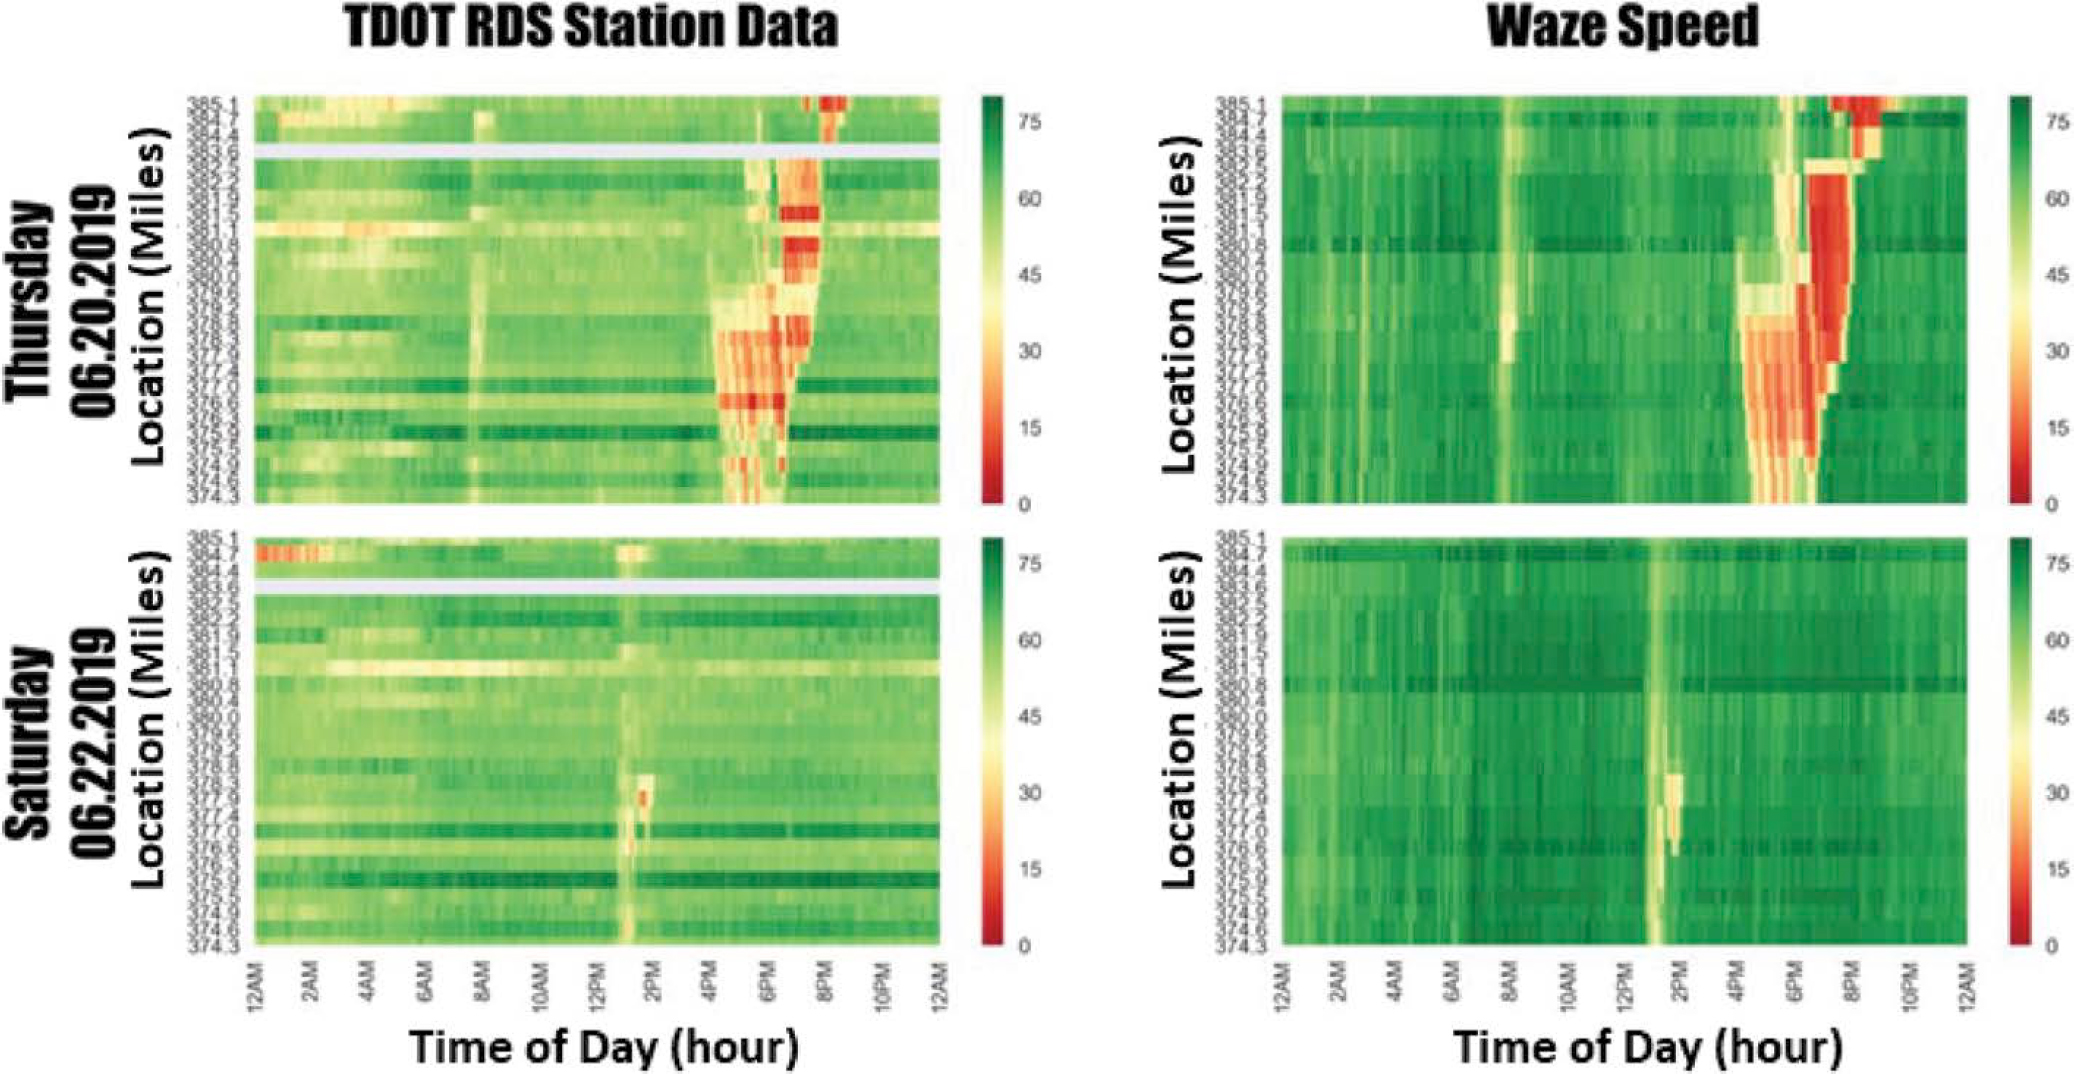
Source: L. Han and B. Freeze, “Tennessee Waze Data Verification,” unpublished presentation at FHWA EDC-5 Peer Exchange Workshop, 2019.
Note: RDS = radar detection system.
It found that there was a greater match rate on Interstate highways than on other roadways. Challenges in comparing the two datasets included how the location and time of incidents were reported by Waze users and the ability to match these incidents with crash reports. Additionally, TDOT crash data do not include all incident data sources, which further limits the correlation between datasets.
VDOT and the Virginia Transportation Research Council (VTRC) evaluated Waze data over a 3-week period in 2017 (Fontaine and Goodall 2017). The evaluation included all roadways in Virginia and all types of Waze data. The study found that Waze reported “about 20 times more incidents than VaTraffic over the same roads and incident types.” A 2021 VTRC report, Methods to Analyze and Predict Interstate Travel Time Reliability (Zhang et al. 2021), explains that since Waze data include all incidents and events, including minor crashes not included in VDOT databases or crashes that may not be reported to law enforcement, the Waze data may include more incidents than VDOT-maintained data (i.e., VaTraffic).
Another VTRC study in 2017 compared data from the Charlottesville DOT on carcass removal with Waze animal and roadkill data for the same segment (Donaldson 2017). The study found that, at that time, Waze data were not an accurate source for animal–vehicle collisions. There was a 38% match between carcass removal records and Waze records, Waze roadkill entries were 2.6 times greater than the number of carcass removals recorded, and data on roadkill location and species were missing or inaccurate.
Lake County, IL, has found Waze data to be accurate both quantitatively and qualitatively. The county conducted accuracy studies that compared Waze travel time data with Bluetooth data for quantitative accuracy and used closed-circuit television (CCTV) observations on random routes to confirm the qualitative accuracy of Waze congestion notifications (Effinger 2020). More anecdotally, travel times displayed on portable changeable message signs throughout the county were well received by the public, with no complaints about accuracy.
Lake County, IL, has found Waze data to be accurate both quantitatively and qualitatively.
Waze for Cities Partnership Considerations
Agencies that are Waze for Cities partners share data with Waze in a cost-free exchange. In exchange for traffic and event data from Waze, Waze partners share information on road closures, construction, and maintenance that temporarily blocks lanes or roadways. Agencies can also send alerts and share the location of service vehicles, such as snowplows or maintenance vehicles, and monitor and update temporary closure status. Location and start and end times can be provided by partner agencies through the Waze Data Feed and the Waze Map Editor in XML and JSON formats. For information about Waze for Cities data sharing tools, see https://support.google.com/waze/partners/answer/10618047.
Partnership considerations include agreement language and requirements that may not fit with traditional agency contracting practices. For example, data are shared free of charge in an exchange of Waze data and agency data. In one case, an agency had to modify the Waze agreement to accommodate restrictions on receiving data free of charge. Another state agency is unable to become a Waze for Cities partner because the program no longer supports changes to the agreement, and the agency cannot abide by the agreement due to the state’s liability statutes.
Waze guidelines for data attribution can also create challenges for agencies. Waze requests that Waze data published by partner agencies include use attribution as part of their agreements. Attribution presents a legal hurdle for many agencies that wish to partner with Waze. Waze prefers agencies to attribute live data to Waze and remove attribution as data ages to more than a few minutes after the data push time. Agencies have addressed the attribution issue differently as they share traveler information. Some agencies, such as the Maine DOT, have chosen not to publish events from Waze. The Kentucky Transportation Cabinet (KYTC) provides delay and
event data from Waze in a separate layer in the 511 telephone system, advising users to consult the Waze app for real-time information. The Utah DOT pushes data to Waze, and Waze provides attribution to the agency. VDOT and TDOT provide a separate layer in their 511 data (FHWA, “Validating, Filtering, and Using Free Crowdsourcing Data: Peer Exchange Summary Report,” unpublished paper, 2019).
Waze map editors are a community of local experts who help Waze keep its map up to date. Waze users can become map editors by creating an account to make edits to the map. On the basis of the number of map edits they make, map editors may move up a ladder of levels as they make edits and become more competent making edits. Waze offers tutorials, mentors, and a forum to support the community of map editors. Agencies can improve traffic routing, closure updates, and other timely information by developing relationships with their local Waze map editors. Some agency partners have Waze map editors on staff or use Waze data sharing tools, such as the Closure Tool, to add information in the Waze Map Editor.
Sharing Data with Waze
Waze has developed a suite of tools for use by Waze for Cities partners to facilitate data sharing. Partners share road closures through the Closure Tool to identify and remove existing closures and temporary routes or sections of roads that are blocked. When partners manually add road closures through the Closure Tool via the Waze Map Editor, Waze will not route traffic through these closures. The Reporting Tool allows partners to add incidents, hazards, traffic jams, or other timely information to the Waze map in advance of a planned activity or in real time. Similarly, the Partner Feed can share real-time and planned information with Waze users, including planned maintenance or construction or the location of fleet vehicles such as snowplows or maintenance vehicles.
Waze can also work with partners in the event of a crisis or emergency that affects a community. Waze crisis support accepts information from partners that includes the type of crisis, the expected timeline (start and duration), and the severity. Waze takes information on the geographic limits, roadways impacted, and the location of shelters or crisis centers. Waze evaluates the information to share crisis data with the Waze community.
The North Carolina DOT (NCDOT) conducted a crisis response exercise with Waze in the spring of 2022 that focused on a hurricane scenario. The drill used Waze data to monitor road and traffic conditions, and NCDOT shared information on road closures and evacuation zones with Waze. Waze created a map polygon for the requested evacuation zone that could be added to the Waze map during the event (Figure 8-5). The drill increased the familiarity of the NCDOT staff with Waze tools and the Waze Crisis Team (Webster 2022).
Strategies and Tools for Deriving the Greatest Value
Partner agencies can enhance the usefulness of Waze data through customized applications and in-house programs. KYTC uses Waze, third-party vehicle probe data, and multiple sources of infrastructure data to address a broad number of use cases, including traveler information, incident detection and management, work zone management, maintenance, and snow and ice management. KYTC is developing congestion mitigation, maintenance performance measures, secondary crash detection, signal timing, and predictive analytics applications for the data. KYTC stores the data using BigQuery on the Google Cloud, and the system can process 26 million records per day. KYTC also stores 1 year of data for reporting and dashboard applications. KYTC uses Google Data Studio to build dashboards and reports, including traffic alerts, traveler information, incident detection, work zone monitoring, roadway weather, crash mitigation, snow and ice performance, traffic impacts of road closures, and flooding (Lambert 2022).
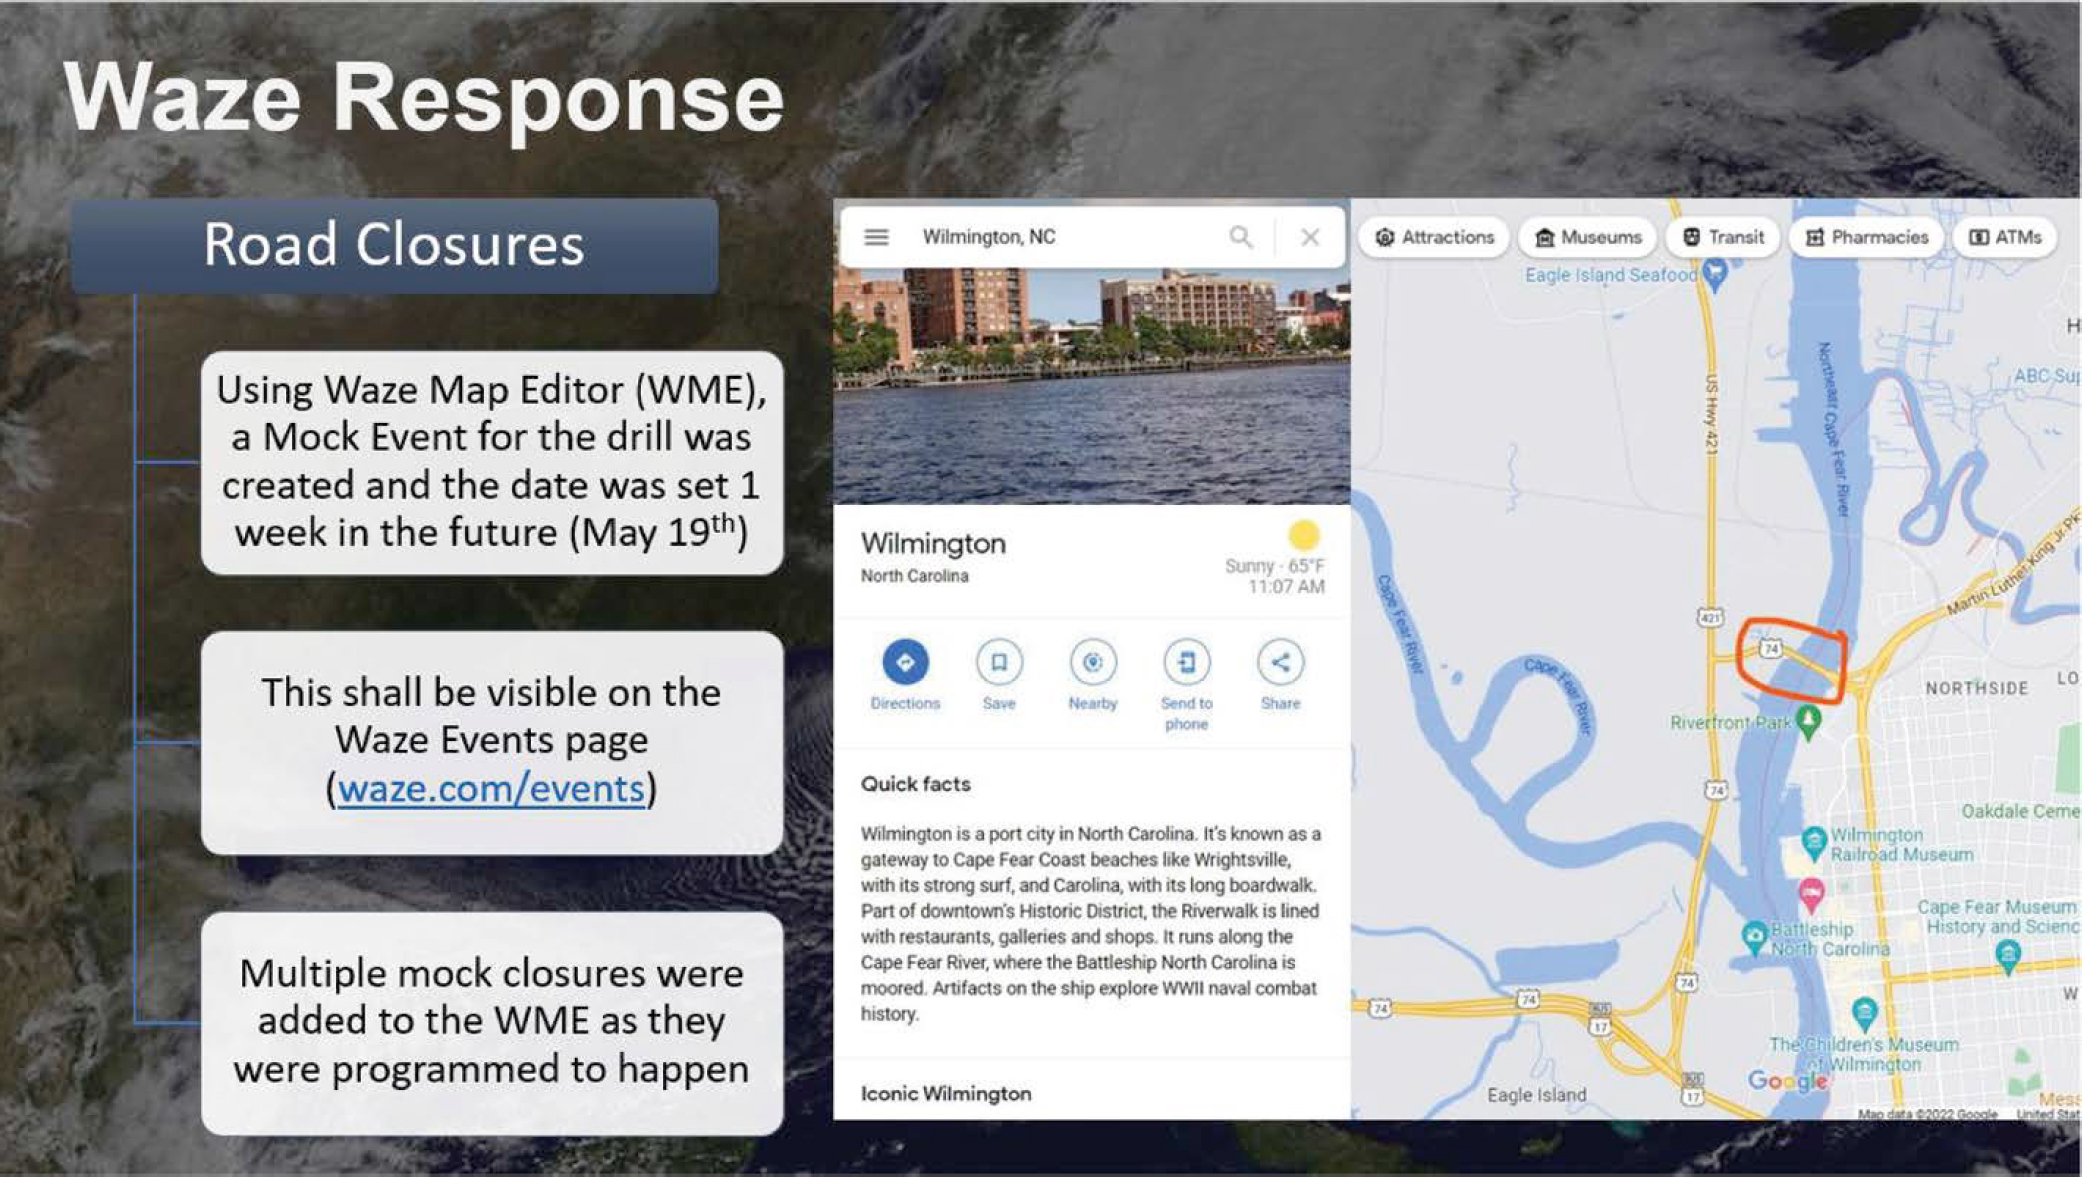
Source: Webster (2022).
Transportation agencies are integrating Waze data into their ATMS to support system monitoring and operations. One example is the Florida DOT’s (FDOT’s) SunGuide system, which integrates Waze data and other third-party data to confirm and monitor system operations. Waze data are particularly helpful in areas where FDOT does not have intelligent transportation system (ITS) equipment in place. The agency verifies the data confidence level through Waze’s user likes, noting that once an event reaches a certain threshold in SunGuide, it populates as a flashing icon on the SunGuide Operator Map. Operators confirm location, incident type, and potential lane blockages through responding law enforcement and access the Waze Live Map for additional information (FDOT District 5 2020). FDOT was one of the first state DOTs to partner with Waze and has used Waze data since 2014. The agency uses SunGuide’s incident detection subsystem to retrieve a direct XML feed from Waze and generates alerts for operators. The DOT filters the data to eliminate alerts that the operators do not use (I-95 Corridor Coalition 2017). Many other state agencies such as New Hampshire, Maine, Connecticut, and Pennsylvania have or are in the process of developing an interface to make Waze data usable by operators and to integrate the data with their ATMS.
One of the many benefits for local agencies of the Waze for Cities program is that it provides extensive, high-quality data through the Traffic View interface with no additional investments in monitoring or ITS equipment. As noted earlier, the Traffic View live map provides a graphical interface based on an agency’s defined polygon area that displays information through clickable icons, as seen in Figure 8-6. For information about Waze Traffic View, see https://support.google.com/waze/partners/answer/10618174#zippy=%2Cwaze-o-meter%2Ctraffic-view-live-map.
The city of Irving, TX, is integrating Waze data into its traffic management system by using the Lake County, IL, Travel Time Poller discussed earlier. The city uses Waze user alerts for
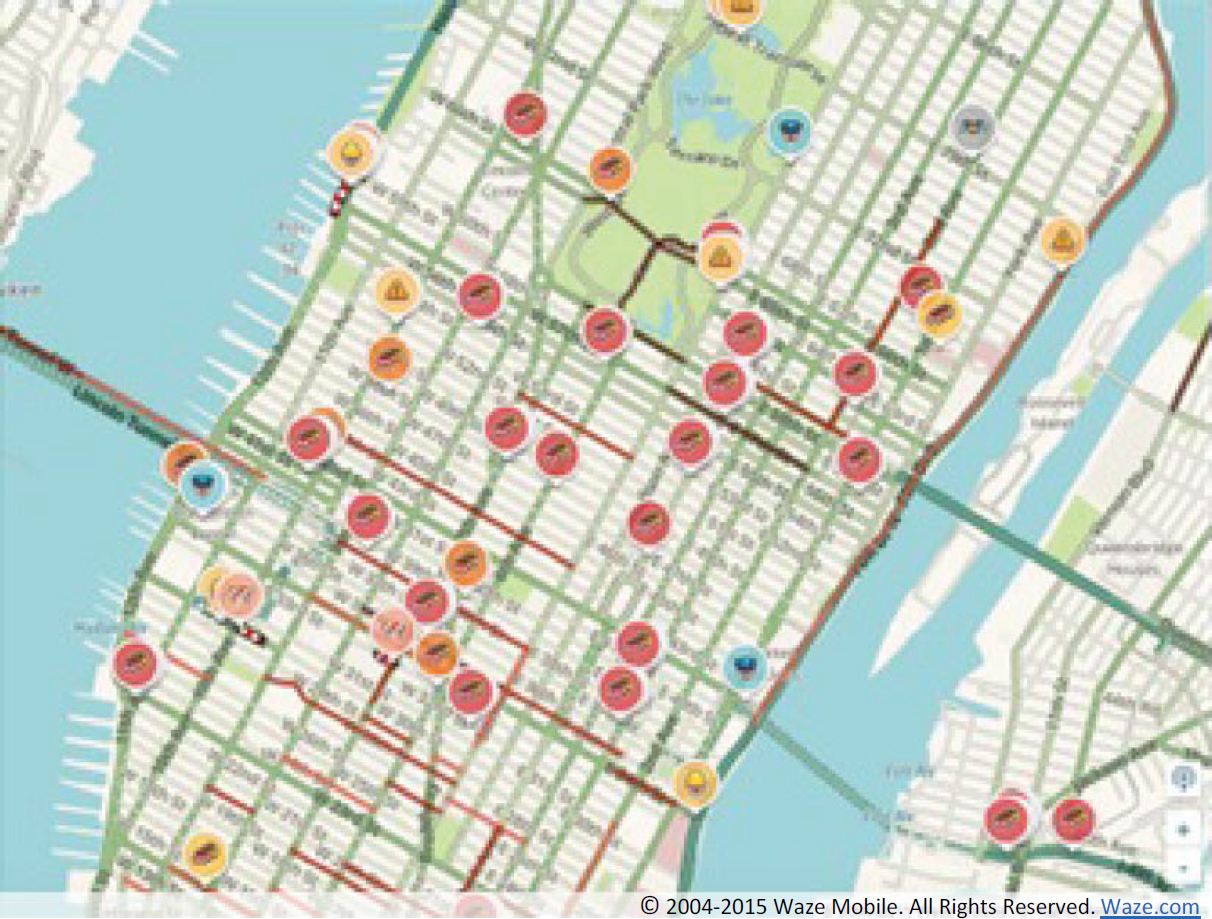
Source: Waze (used with permission).
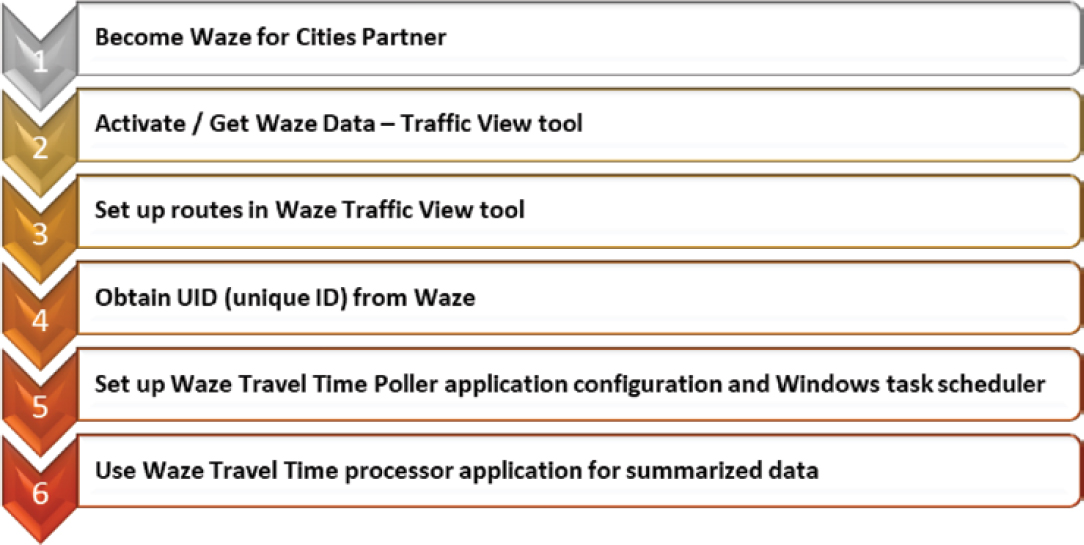
Source: M. Ahmed, “Waze Travel Time Poller Implementation and Uses for Local Government Agencies,” unpublished presentation at FHWA EDC-6 Crowdsourcing for Advancing Operations Cohort Meeting, “Making Waze Data Operator Friendly,” May 2022.
congested conditions and travel time data to complement signal performance measure data. Travel time data are used to monitor roadways and report events, for before-and-after studies of system changes, to detect incidents and deploy incident timing plans, and to manage congestion. The process the city of Irving used to implement the Lake County Travel Time Poller application is shown in Figure 8-7.
Waze data can also be archived and used for planning analyses to identify and address recurring or correctable traffic patterns. One way to work with the data is through Waze Hub, which can integrate Waze data with geographic information system (GIS) software (Waze n.d.). Commercial data integrators and platforms can combine and synthesize data collected through infrastructure sensors and devices, connected vehicles, and third-party data such as Waze. Many data integrators process various data and analytics from Waze as a part of their offering.
Fleet vehicles, such as emergency response, construction, or maintenance vehicles, can automatically send alerts to approaching drivers through Waze and other in-vehicle platforms. There are also CAD enhancement tools that interface with Waze and feature live tracking, reporting, weather, and decision support capabilities. These third-party products and services that interface with Waze can improve the efficiency of providing traveler information.
Agency Concerns, Needs, and Future Opportunities for Waze
Local and state agencies have raised significant concerns with commercial vehicles using Waze for navigation and either becoming stuck on a local road or not meeting overpass clearance requirements. Many communities have observed significant increases in traffic on local and neighborhood roads; however, few have implemented roadway use designations to prevent this from happening.
A 2019 FHWA-sponsored peer exchange on using crowdsourced data identified specific concerns and capability needs among state Waze for Cities partners. A fundamental conflict in the partnership between Waze and transportation agencies rests on the objectives of a for-profit business and the safety and mobility mission of DOTs. Often the alternate routing proposed by
a state agency is different than the routing advised by Waze. This is an issue across all navigational apps. Many states also noted that, with more than 3,000 partners around the globe, partner agencies are finding outreach and feedback with Waze more challenging. Following are some of the needs identified by peer exchange participants:
- More detailed user information related to partial road closures and specific lane blockages;
- The ability of DOTs to propose alternate routes or detour information for evacuations or other events for use by Waze;
- Consideration of the impacts of safety and truck routing with regard to routing traffic (e.g., bridge clearances or weight limits, infrastructure conditions, residential street geometry); and
- DOT opportunities to help train Waze users on reporting information on potholes and roadkill, including size, lane location, and voice-based content.
Transportation agencies also suggested that traffic management center operators and supervisors engage Waze in developing a Waze interface for use in traffic management centers. The peer agencies proposed a traffic management center interface that includes the following features:
- Administrative-level filtering capability related to reliability, confidence, and report type with easy-to-use changes to filtering levels;
- Color-coding parts of the Waze entry for easier visual attribution;
- Different levels of Waze filtering for road, time of day, or regions based on validation and levels of ITS infrastructure;
- Filtering out incidents reported by an agency that are then reported by Waze with a different unique identifier;
- Connecting Waze data directly to the ATMS with validation of certain fields;
- Automatically linking ATMS or Waze event updates with original event records; and
- A performance dashboard for operators and managers to demonstrate the value of sharing information with Waze and help operators improve their performance.
Even when concerns and limitations are recognized, Waze still provides a cost-effective source of traffic and event data with which agencies can fill gaps in their monitoring and reporting infrastructure. Waze continues to grow in terms of both users and partners, and its capabilities and reliability are increasing. Agencies interested in expanding their data sources can use Waze data with minimal investment in reporting and software enhancements.
References
Donaldson, B. (2017). Improving Animal–Vehicle Collision Data for the Strategic Application of Mitigation. Charlottesville, VA: Virginia Transportation Research Council. https://www.virginiadot.org/vtrc/main/online_reports/pdf/18-r16.pdf.
Effinger, J. (2020). Integrating Crowdsourced Data into Automated Traffic Signal Performance Measures (ATSPM). Adventures in Crowdsourcing: Traffic Signal Applications. https://www.transportationops.org/ondemand-learning/adventures-crowdsourcing-traffic-signal-applications-edc5-webinar-series.
FDOT (Florida Department of Transportation) District 5. (2020). Integrated Corridor Management Standard Operating Guidelines. Tallahassee, FL: Florida Department of Transportation. https://cflsmartroads.com/projects/design/docs/ICM_RTMC_SOG.pdf.
FHWA. (2020). Crowdsourcing for Operations Case Study: City of Louisville, Kentucky. Center for Accelerating Innovation, Every Day Counts. Washington, DC: U.S. Department of Transportation. https://www.fhwa.dot.gov/innovation/everydaycounts/edc_6/docs/crowdsourcing_case_study_louisville.pdf.
FHWA. (2023). Crowdsourcing for Advancing Operations. Center for Accelerating Innovation, Every Day Counts. Washington, DC: U.S. Department of Transportation. https://www.fhwa.dot.gov/innovation/everydaycounts/edc_6/crowdsourcing.cfm.
Fontaine, M. D., and Goodall, N. J. (2017). Evaluation of Waze Data. Presented at I-95 Corridor Coalition Crowdsourcing Summit, Philadelphia, PA, September 14, 2017. https://tetcoalition.org/wp-content/uploads/2017/08/8-VDOT_I-95_CC-Waze_Presentation-final.pdf.
I-95 Corridor Coalition. (2017). Going My WAZE to Closing Real Time Data Gaps. Presented at I-95 Corridor Coalition Crowdsourcing Summit, Philadelphia, PA, September 14, 2017. https://tetcoalition.org/wp-content/uploads/2017/08/I-95_Crowdsourcing_Summit_Rpt-September_2017-FINAL.pdf.
Lambert, C. (2022). Work Zone Monitoring. Adventures in Crowdsourcing Webinar Series: Work Zone Data and Crowdsourcing. https://transportationops.org/ondemand-learning/work-zone-data-and-crowdsourcing-1.
Legare, R. (2021). Adventures in Crowdsourcing: Open Source Code to Jumpstart Analytics. https://transportationops.org/ondemand-learning/adventures-crowdsourcing-open-source-code-jumpstart-analytics.
Schnuerle, M. (2020). Using Crowdsourced Data and Open Source Tools in Government. Adventures in Crowdsourcing: Data Management and Governance for Better Crowdsourced Data Applications. https://transportationops.org/ondemand-learning/adventures-crowdsourcing-data-management-and-governance-better-crowdsourced-data.
VDOT (Virginia Department of Transportation). (2021). Crowdsourcing Data: VDOT & Waze. YouTube. https://www.youtube.com/watch?v=C_Bb9eS2ReE, 2021.
Waze. (n.d.). Waze for Cities Data Program. https://web-assets.waze.com/cms/Waze%20for%20Cities-Two-Pager_DIGITAL_Final.pdf.
Webster, N. (2022). North Carolina DOT (NCDOT) Crisis Response Planning and Waze. Adventures in Crowdsourcing Webinar Series: Collaborating with Navigation Providers. https://www.transportationops.org/ondemand-learning/collaborating-navigation-providers.
Zhang, X., Zhao, M., Appiah, J., and Fontaine, M. D. (2021). Methods to Analyze and Predict Interstate Travel Reliability. Charlottesville, VA: Virginia Transportation Research Council. https://www.virginiadot.org/vtrc/main/online_reports/pdf/22-R2.pdf.
Zhang, Z. (2020). Exploring the Potentials of Using Crowdsourced Waze Data in Traffic Management: Characteristics and Reliability. PhD dissertation. University of Tennessee Knoxville. https://trace.tennessee.edu/cgi/viewcontent.cgi?article=7107&context=utk_graddiss.


