Data Integration, Sharing, and Management for Transportation Planning and Traffic Operations (2025)
Chapter: 7 Freight Data Interoperability Framework: Update
CHAPTER 7
Freight Data Interoperability Framework: Update
Over the years, researchers and practitioners have made attempts to address differences in freight data sources as well as in data collection, querying, and fusion methodologies. However, most studies focus on specific data sources or aim to address a specific use case. The process of developing a consolidated and comprehensive freight database is challenging. Differences in spatial and temporal data collection methods, modes of transport, privacy issues, and the limited number of available tools create significant limitations in this field. The ever-changing nature of data further complicates maintaining an interoperable freight data architecture and the need to update the architecture.
This chapter presents a simplified, generic, and robust freight data query methodology that data enthusiasts can use to encourage the implementation of an interoperable freight data architecture. The chapter first presents a summary of the current state of the practice in freight data interoperability, specifically, in the areas of data processing, data fusion, and data querying. This summary is followed by a discussion of the proposed freight data querying methodology. The chapter showcases various use cases of the querying methodology and its preliminary implementation. The methodology and examples illustrate the feasibility of resolving some of the differences in definitions of data elements and the shift toward interoperability in freight data sources. The references cited are listed at the end of the chapter.
Current State of Practice
NCFRP Report 35: Implementing the Freight Transportation Data Architecture: Data Element Dictionary provided recommendations to effectively identify and resolve differences in data element definitions across multiple freight data sources (Walton et al. 2015). The report identified differences in definitions and assessed whether crosswalks or other bridges are adequate and relevant. It also recommended new harmonization or statistical bridges, as appropriate, for resolving differences in definitions. The report highlighted the need for an interoperable freight data architecture to help strengthen multimodal efforts to collect freight data; enable interoperability between multiple systems; and aid with the verification of data accuracy and data validation, gap identification, and integration for seamless exchange of information.
Since the publication of NCFRP Report 35, new freight-related datasets have gained popularity and achieved widespread use. These datasets include the Global Positioning System (GPS) electronic logging devices (ELDs), and location-based services (LBS), and data vendors include the American Transportation Research Institute (ATRI), INRIX, StreetLight, Geotab, and Drivewyze. Other specialty data providers include Trucker Path, which provides truck parking information, and Promiles, which provides information on oversize/overweight routing.
This section summarizes the current state of the practice as it pertains to freight data processing, fusion, and querying since the publication of NCFRP Report 35. The summary broadly describes recent advances in how agencies are using new datasets to address existing needs in the domain of freight transportation data.
Data Processing
Mejia et al. (2017) aimed to expand existing freight performance measures and organize them into an integrated framework of safety, mobility, traffic congestion, and environmental sustainability analysis. As each criterion consists of several qualitative and quantitative indicators, the authors proposed an ontology-based approach to address the challenge of integrating freight data from different sources and formats. Using a bottom-up, data-driven approach, the authors created the Freight Performance Ontology to reduce heterogeneity between data sources. Though promising, the published ontology was mainly for safety analysis, and other use cases were not extensively developed.
Camargo et al. (2017) acknowledged the challenges associated with truck GPS data by stating that, though commercially and readily available, the tools to analyze these datasets were limited. In their paper, “Expanding the Uses of Truck GPS Data in Freight Modeling and Planning Activities,” they described a limited number of available tools that transform GPS data into trajectories on the network. They also examined expanding the use of truck GPS data beyond just origin–destination matrices by gathering time-of-day information and trajectory data for visualization.
Data Fusion
Freight data sources are often limited, and fusing different sources and extracting linked insights can be a major hurdle. Eluru et al. (2018) examined the data fusion techniques of two commonly used freight public data sources: the Freight Analysis Framework (FAF) and Transearch. Although these two sources provide annual commodity flows for the United States, it is difficult to combine them, given the different methods of data collection and mechanisms as well as the varying spatial and commodity type resolution. Eluru et al. proposed a process for estimating county-level commodity flows through a joint econometric model framework embedded within a network flow approach and grounded in a maximum likelihood technique. They also developed truck origin–destination flows by different weight categories, which allowed for the estimation of empty flows and the patterns associated with them. Though the study acknowledged additional sources, such as weigh-in-motion (WIM) data, the methodology is limited in terms of providing a homogenous tool for freight data fusion.
Hernandez and Hyun (2020) fused weight data from WIM sites with GPS data from equipped trucks to address the estimation of the distribution of gross vehicle weight at traffic count sites. Their methodology relied on combining Gaussian mixture models, which are estimated at WIM sites and are defined to be spatially related to the traffic count site. While this method provides an adequate goodness of fit between observed and estimated distributions of vehicle weight, it is tailored to address fusion between a limited number of specific data sources.
Asborno (2020) focused on data fusion techniques across several freight modes and on the challenges related to heterogeneity, confidentiality, and varying spatial and temporal coverage, among others. This study leveraged automatic identification system (AIS) data to integrate inland waterway transportation data with commodity-based freight forecasting models. The methodology relied on mapping maritime AIS data to a detailed inland waterway network and
then fused it with GPS data onto a multimodal network to identify the area of impact of a freight investment. This approach allowed for the identification of truck and vessel flows in parallel and highlights the potential for modal shift. In addition, Asborno fused truck GPS and Lock Performance Monitoring System (LPMS) data by using a multicommodity assignment model to quantify annual commodity throughput at port terminals on inland waterways.
On a more holistic level, You et al. (2020) explored the development of a generic Future Mobility Sensing (FMS) system that aimed to address data collection issues, management of data flows, the fusion of multiple data sources, and data visualizations to understand travel behavior. The FMS provides three main functionalities: a data collection platform, a data management platform, and a data fusion and visualization platform. The three platforms work together to facilitate data-driven decision-making. While the FMS is highly promising as a tool for overcoming data inconsistencies, additional testing and calibration would help make it more applicable to various use cases. You et al. also highlighted the importance of timeline verification for input data, especially shipment timeline verification, which is often difficult to determine.
Bauer and Purdy (2017) highlighted the challenges that regional and local transportation agencies face due to fragmented and spatially nongranular data sources. To address these challenges, the team used geographic information systems (GIS) and spatiotemporal models that characterized data relationships to spatially align all public and private datasets. The outcome of the project was a dynamic freight database that houses all freight-related data for an agency and that can be used for future freight planning tasks. Stakeholder outreach and engagement were valuable when future freight data improvements were being discussed. The lessons learned in this study included (1) the need to continuously update freight datasets to align with updated and emerging data sources and (2) the importance of understanding the benefits and costs of data prior to data collection efforts. The study offered valuable insights into the importance of a homogeneous database while highlighting the challenges around continuously engaging stakeholders and updating the data.
Data Querying
Seedah et al. (2016) developed a hybrid ontology in which disparate data sources could be well described by their unique ontologies and then mapped to a single upper-level “global” ontology. This approach afforded enough integration at the global ontology level to allow all databases to respond to the same queries while remaining flexible enough to allow for data sources to be added or modified. This ontological structure was developed using the role-based classification schema, which uses two levels of classification at the global level: a primary grouping based on data category and a secondary grouping based on whether the datum was an identifier or a descriptive feature. There were nine primary categorical groups: time, place, link, mode, commodity, industry, events, human, and unclassified. Each of these primary groups had at most two subcategories for identifiers and features, to which all data fields from local ontologies were then mapped. In this way, the global ontology’s organization remains clear even when complex local ontologies are associated with it. The advancements of new datasets and vendors present an opportunity to revisit the hybrid ontology and further simplify the querying parameters proposed.
Summary of Literature Review
Several attempts have been made to address differences in freight data sources as well as data collection, querying, and fusion methodologies; however, most studies address specific sources or aim to address a specific need. The process of developing a consolidated and comprehensive freight database is challenging. Differences in spatial and temporal data collection methods,
modes of transport, privacy issues, and the limited number of available tools create significant limitations in this field. The ever-changing nature of data complicates the need to continuously update and maintain an interoperable freight data architecture.
Freight Data Querying Methodology
This section presents a simplified, generic, and robust freight data query methodology that freight data enthusiasts can implement to drive the shift toward standards that resolve the differences in definitions of data elements. Querying multiple freight data sources helps identify which data source or sources provide the best answer to one or more questions. It also aids practitioners in comparing results from different sources, verifying data accuracy, conducting cross validation tasks, and identifying gaps in data collection efforts.
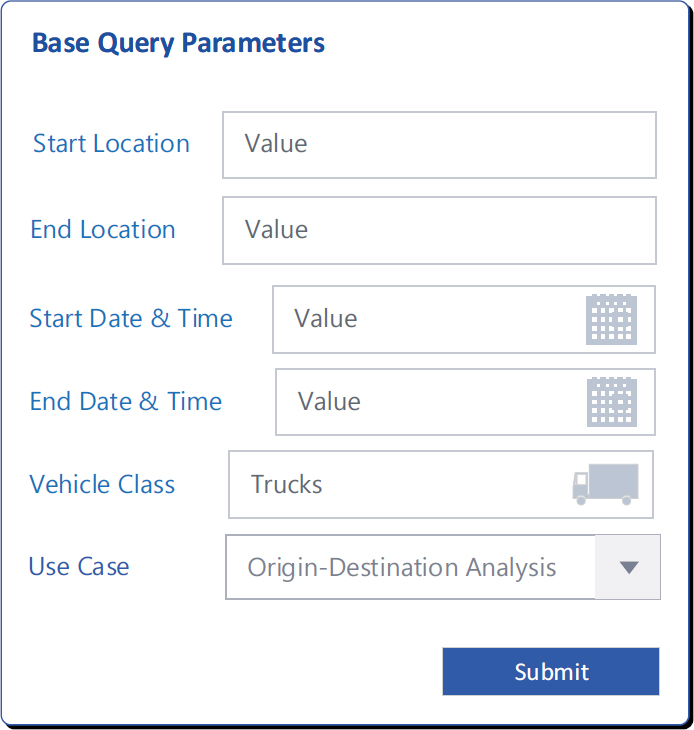
The proposed methodology assumes four base parameters for querying most freight data sources: location, time, vehicle classification, and use case. Other parameters, such as route and geographic extent, are inferred from the start and end locations specified as part of the data query. Following is additional information on the specified base parameters:
- Start and end location: This parameter comprises the start and end locations of interest and can be a named location (county, city, traffic analysis zone, zip code, census block group, census tract) or a set of geographic coordinates for a specific location represented by one or more latitudes and longitudes (point, line string, or polygon).
- Start and end date/time: This parameter is a date timestamp representing year, month, day, and time.
- Vehicle classification: This parameter provides the option to either aggregate or filter vehicles using one or more of the following classifications: all trucks, light duty, medium duty, heavy duty, or the FHWA vehicle classification system. Additional details are provided in the latter sections of this chapter.
-
Use case: This parameter defines the purpose for which the data query is being performed and determines which additional steps are required to achieve the expected outcome. Use cases tested with the proposed methodology include
- Origin–destination analysis: traffic volumes and carloads, among others;
- Congestion analysis: traffic delay, delay per mile, travel time index, travel time reliability, and congestion cost;
- Safety analysis: crash counts, manner of collision, weather conditions, time of day, surface conditions, light conditions, and contributing factors;
- Bridge condition and vertical clearance analysis: count of bridges that are structurally deficient, functionally obsolete, or do not meet vertical clearance requirements;
- Pavement condition assessment: international roughness index (IRI) and distress score; and
- Socioeconomic analysis: population, median household income, gross domestic product (GDP), labor force trends, and employment information.
With the base parameters defined, the next step is to identify commonalities and differences in data elements when working with multiple freight data sources. The following sections provide the suggested approach for reconciling differences in location, time, and vehicle classification. An approach to addressing vehicle routes, which are inferred from the start and end locations, is also presented.
Start and End Location
The Census Bureau’s geographic entity definitions provide a uniform identification for the start and end locations. The steps involved in transforming location data from the output of
private data vendors [StreetLight, Geotab, INRIX, National Performance Management Research Data Set (NPMRDS)] into a census-defined geographic identification (ID) are illustrated in Figure 7-1.
Routes
Multiple conflation methods exist for routes (Daneshgar et al. 2018, Lasley et al. 2021, Zhang and Chen 2023). For the proposed data query model, the ability to query a single network and be able to identify attributes that contain information about other networks is desired. Therefore, the LinkerAT tool (also developed as part of NCHRP Project 08-119 and described in Chapter 14) is recommended, though other conflation methods or an open standard, such as the OpenStreetMap network, may be used.
Vehicle Classification
Multiple truck classification systems currently exist, including the gross vehicle weight rating-based classification (U.S. Department of Energy n.d.), the aggregated group classification (U.S. Department of Energy n.d.), the FHWA Highway Performance Monitoring System (HPMS) annual average daily traffic classification (FHWA 2016), and the FHWA 13-category vehicle classification (FHWA 2022). A direct correlation between the various classification systems is challenging to achieve, as vehicle weight does not necessarily reflect vehicle axles. Therefore, Table 7-1 offers a suggested vehicle classification mapping for data analysts, though caution is required when inferring between weight-based and axle-based classification systems.
Suggested Data Attribute Mapping
The suggested data attribute mappings and how they compare to example probe data vendors and traditional data sources are presented in Table 7-2. As shown, the Census Bureau’s geographic entity definitions work across most databases, though custom-defined polygon geometries may be required for some datasets. GeoJSON is a good candidate for interoperability. GeoJSON is an open and widely adopted standard designed to represent simple geographic features, along with their nonspatial attributes. It is a readable, single-file text-based format that can be easily transferred between multiple systems and applications. For vehicle class, the suggested mapping system for truck types (shown in Table 7-1) is recommended, as there is currently support for several datasets. The routing network is probably the most challenging, as it varies for each data source. The LinkerAT network creation methodology is a promising approach to working with multiple networks, though ideally, an open standard, such as OpenStreetMap, is preferred.
Dealing with Data Conflicts
In several use cases, it is possible for comparable datasets to conflict with each other with respect to the information being provided. For example, travel speeds may vary between INRIX and Streetlight, or truck counts may vary between Geotab and ATRI. This is a result of different data collection methods, varying periods of data collection, and differences in spatial aggregation and reporting, among other differences. Walton et al. (2015) and the supporting product of this study, the Data Decision Tree for Big Data in Freight Transportation Planning and Operations (Chapter 6), provide guidelines about crosswalks between different datasets. In general, the following rules of thumb can be used by analysts:
- If dealing with GPS or LBS data, the sample size and fleet mix of the data vendor for a specific geographic location should be considered.
- Use of and confidence in the data by other data analysts over time help to identify possible reasons for discrepancies and anomalies, as described in the literature review.
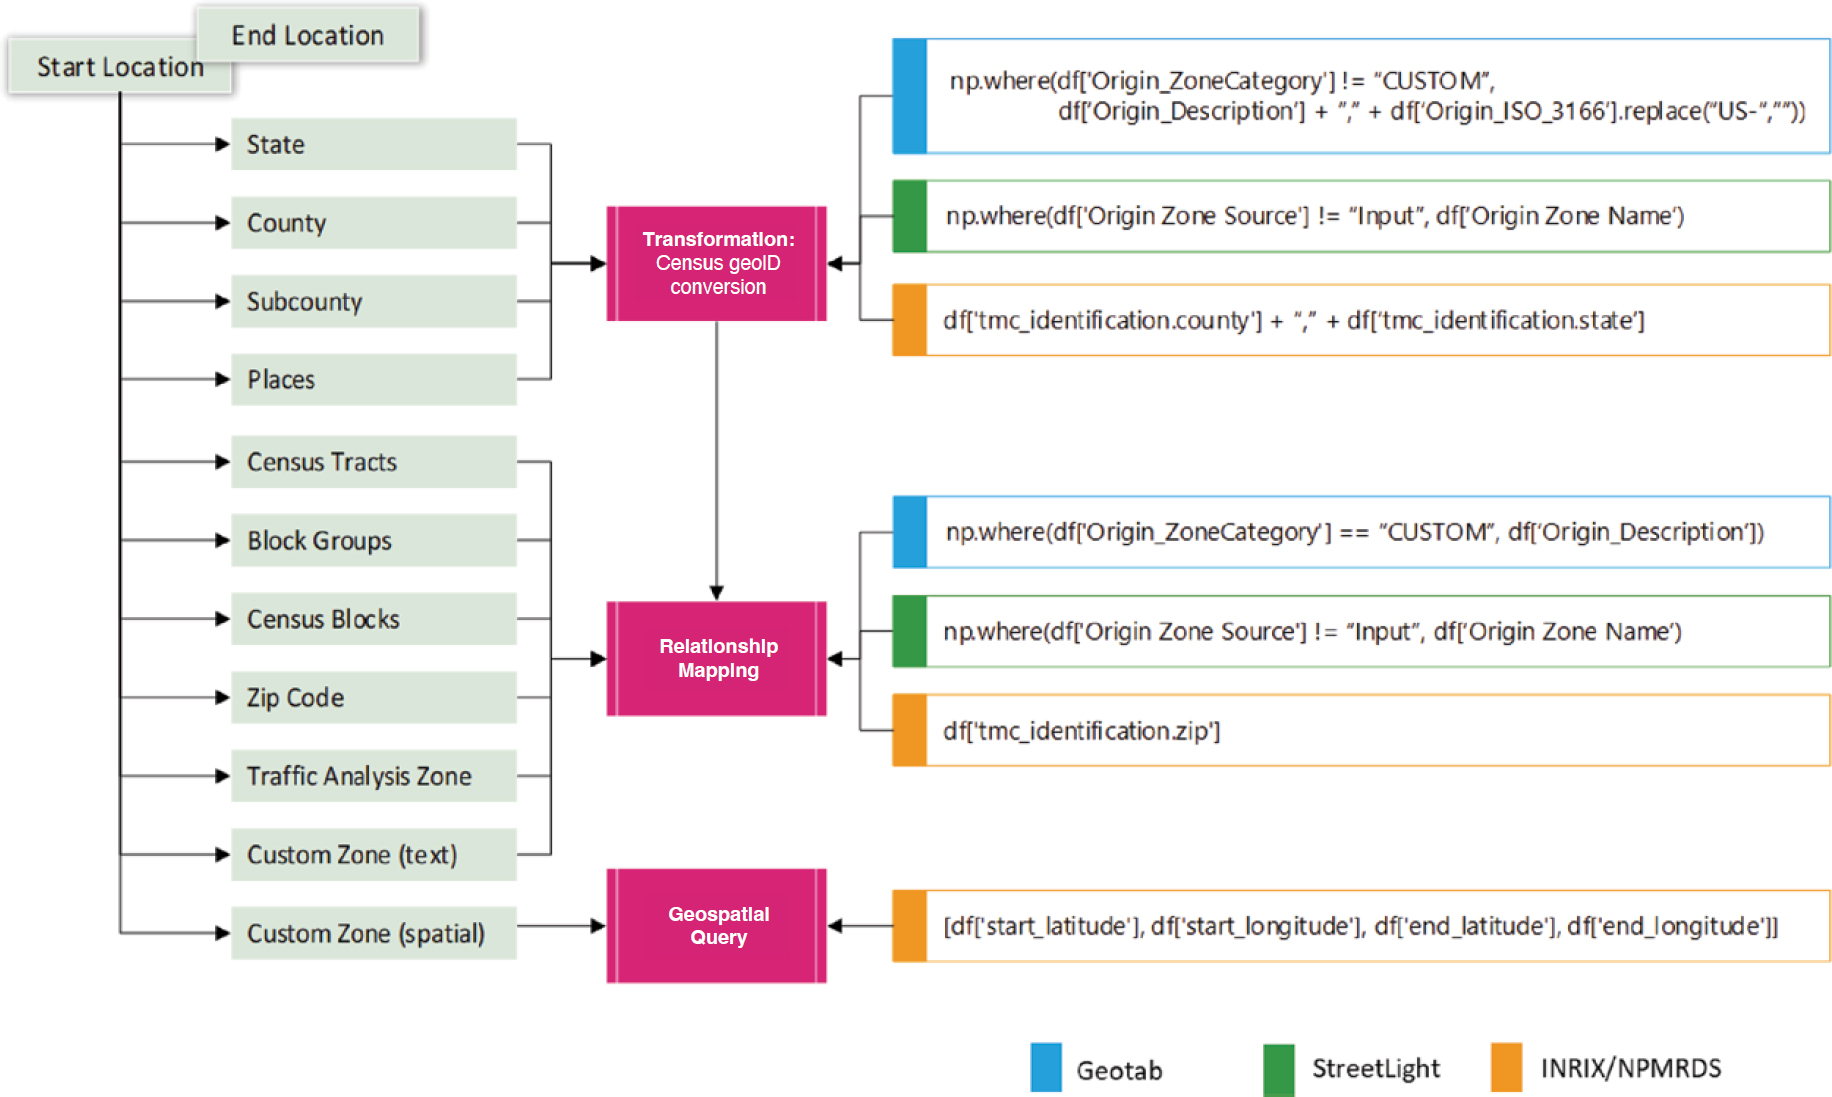
Table 7-1. Suggested vehicle classification data mapping.
| Gross Vehicle Weight Classa | Aggregated Groupa | HPMS ADTb | FHWA 13b | Example Vehiclesc |
|---|---|---|---|---|
| GVWR Class 1: ≤6,000 lb | Light duty | Single-unit trucks | FHWA Class 3 vehicles | 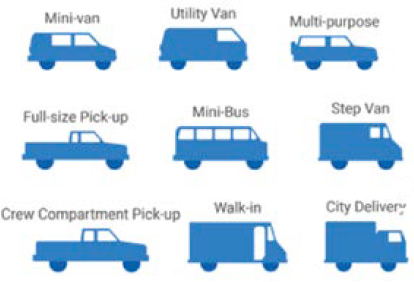 |
| GVWR Class 2: 6,001–10,000 lb | Light duty | Single-unit trucks | FHWA Class 3 vehicles | |
| GVWR Class 3: 10,001–14,000 lb | Light duty | Single-unit trucks | FHWA Class 3 vehicles | |
| GVWR Class 4: 14,001–16,000 lb | Medium duty | Single-unit trucks | FHWA Class 5 vehicles | 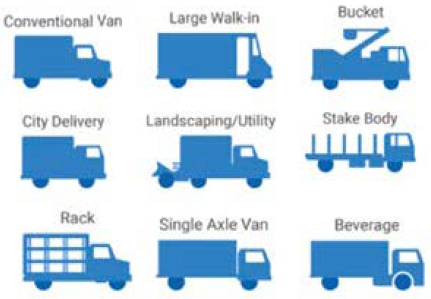 |
| GVWR Class 5: 16,001–19,500 lb | Medium duty | Single-unit trucks | FHWA Class 5 vehicles | |
| GVWR Class 6: 19,501–26,000 lb | Medium duty | Single-unit trucks | FHWA Class 5 vehicles | |
| GVWR Class 7: 26,001–33,000 lb | Heavy duty | Single- and multiunit trucks | FHWA Class 6 and above | |
| GVWR Class 8: ≥33,000 lb | Heavy duty | Single- and multiunit trucks | FHWA Class 6 and above |
Note: GVWR = gross vehicle weight rating; ADT = average daily traffic; COE = cab over engine.
a Weight-based classification: Used in Streetlight and Geotab.
b Axle-based classification.
c Source: Municibid, Understanding Truck Classification, https://blog.municibid.com/understanding-truck-classification/, accessed July 7, 2022.
Use Cases
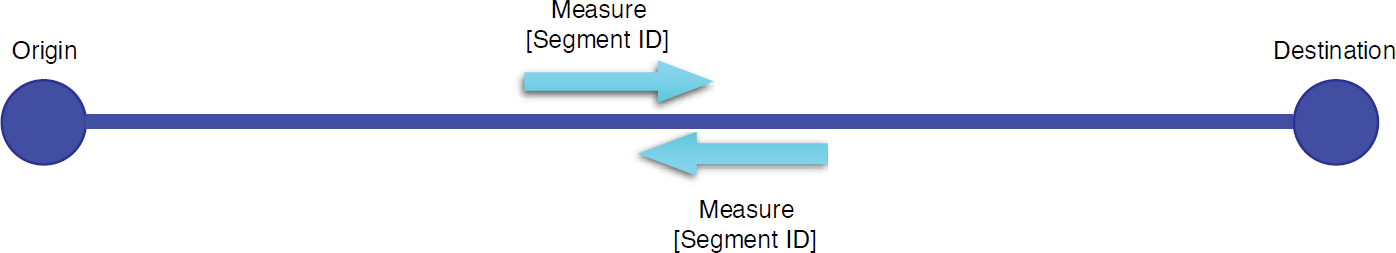
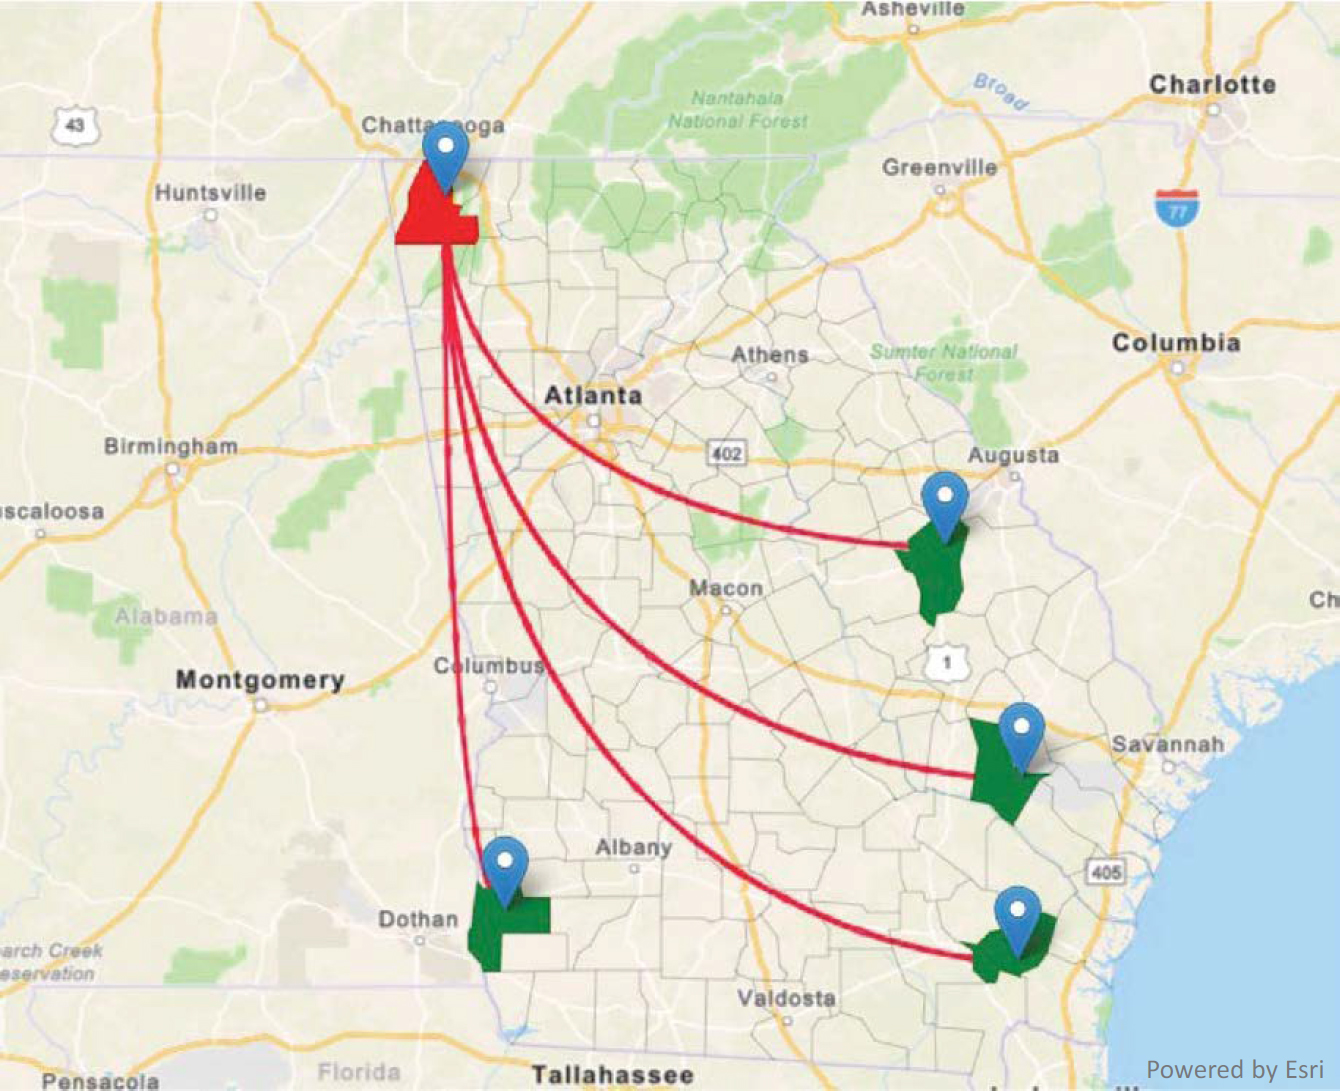
Origin–Destination Analysis
Origin–destination analysis in freight involves the identification of travel patterns through a geographic space in a specific period. The suggested data query methodology is built around this base assumption, in which data can be represented in a few ways, such as traffic volume, carloads, commodity value, commodity weight, number of containers, and number of vessels. The base data requirements for most origin–destination analyses (as represented in Figure 7-2) include
- Origin and destination,
- Analysis measure (e.g., volume, carloads), and
- Optional: path or route as segment IDs.
The suggested data query methodology maps the base query parameters to the respective database(s), where a control logic performs the steps for the specific analysis. The pseudocode for the control logic is as follows:
- Initialize variables: start location as Origin, end location as Destination.
- Optional filters: Path/Route, Start Date, Start Time, End Date, End Time.
Table 7-2. Parameter comparison.
| Parameter | Geotab | INRIX | StreetLight | ATRI | HPMS | Bridge Inventory Data | Crash Database |
|---|---|---|---|---|---|---|---|
| Start/End Location | |||||||
|
Custom location: polygon |
✓ | ✓ | ✓ | ✓ | ✓ | ✓ | ✓ |
|
Named geographya |
|||||||
|
County |
✓ | ✓ | ✓ | — | — | ✓ | ✓ |
|
Subcounty |
— | ✓ | ✓ | — | — | — | — |
|
City |
✓ | — | ✓ | — | — | ✓ | ✓ |
|
Transportation analysis zone (TAZ) |
— | ✓ | ✓ | — | — | — | — |
|
Zip code |
✓ | ✓ | ✓ | — | — | — | — |
|
Census block |
— | — | ✓ | — | — | — | — |
|
Census tract |
— | — | ✓ | — | — | — | — |
| Start/End Time | Date/time | Date/time | Date/time | Date/time | Year | Year | Date/time |
| Vehicle Class | |||||||
|
Light duty |
GVWR Classes 1–3 | Light (≤14,000 lb) | — | — | FHWA Class | — | — |
|
Medium duty |
GVWR Classes 4–6 | Medium (14,0001–26,000 lb) | Medium (14,0001–26,000 lb) | — | FHWA Class | — | — |
|
Heavy duty |
GVWR Class 7, 8 | Heavy (>26,000 lb) | Heavy (>26,000 lb) | — | FHWA Class | — | — |
| Routing Network | OSM | TMC | OSM | Latitude/Longitude | ARNOLD/HPMS | Latitude/Longitude | Latitude/Longitude |
Note: OSM = OpenStreetMap; TMC = traffic message channel; ARNOLD = All Roads Network of Linear Referenced Data.
aApply transformations as illustrated in Figure 7-1.
- Determine which datasets meet the parameters above by using the data attribute mapping summarized in Table 7-2.
- Given the Origin and Destination:
- If route is a filter:
- Find routes between Origin and Destination.
- If multiple routes, enable user to select desired route.
- Aggregate measure as desired.
- If route is a filter:
Congestion Analysis
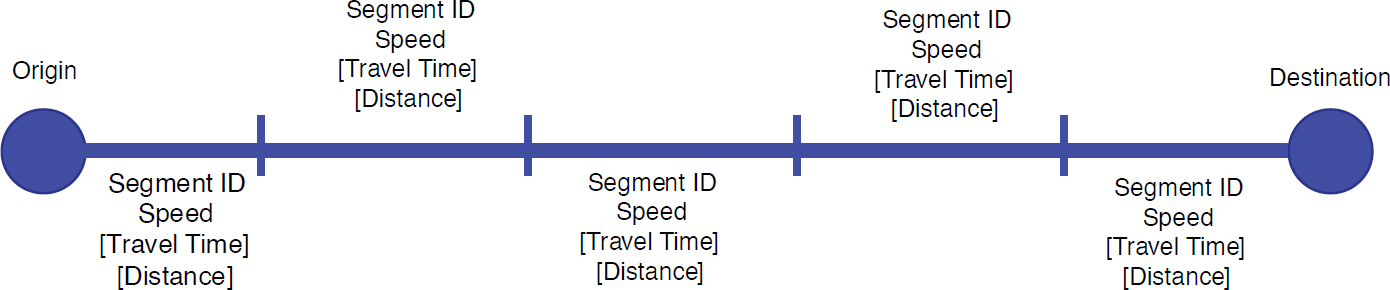
Truck congestion analysis covers mobility measures such as traffic delay, delay per mile, travel time index, travel time reliability, and congestion cost. The base data requirements for congestion analysis (as represented in Figure 7-3) include
- Roadway name,
- Roadway start and end segment,
- Travel speed at a set time increment, and
- Query start and end times.
The suggested data query methodology maps the base query parameters to the respective database(s), where a control logic performs the steps for the specific analysis. The pseudocode for the control logic is as follows:
- Initialize variables: Start Location, End Location, Start Date, Start Time, End Date, End Time.
- Optional Filters: Vehicle Class.
- Determine which datasets meet the parameters above by using the data attribute mapping summarized in Table 7-2.
- Given the Start and End Locations:
- Find routes between Start and End Locations.
- If multiple routes, enable user to select desired route.
- For the desired route, determine segment IDs along that route [default to traffic message channel (TMC) segment IDs].
- For each segment ID, get the speed, travel time, and distance.
- Compute the desired congestion analysis by using the above database outputs.
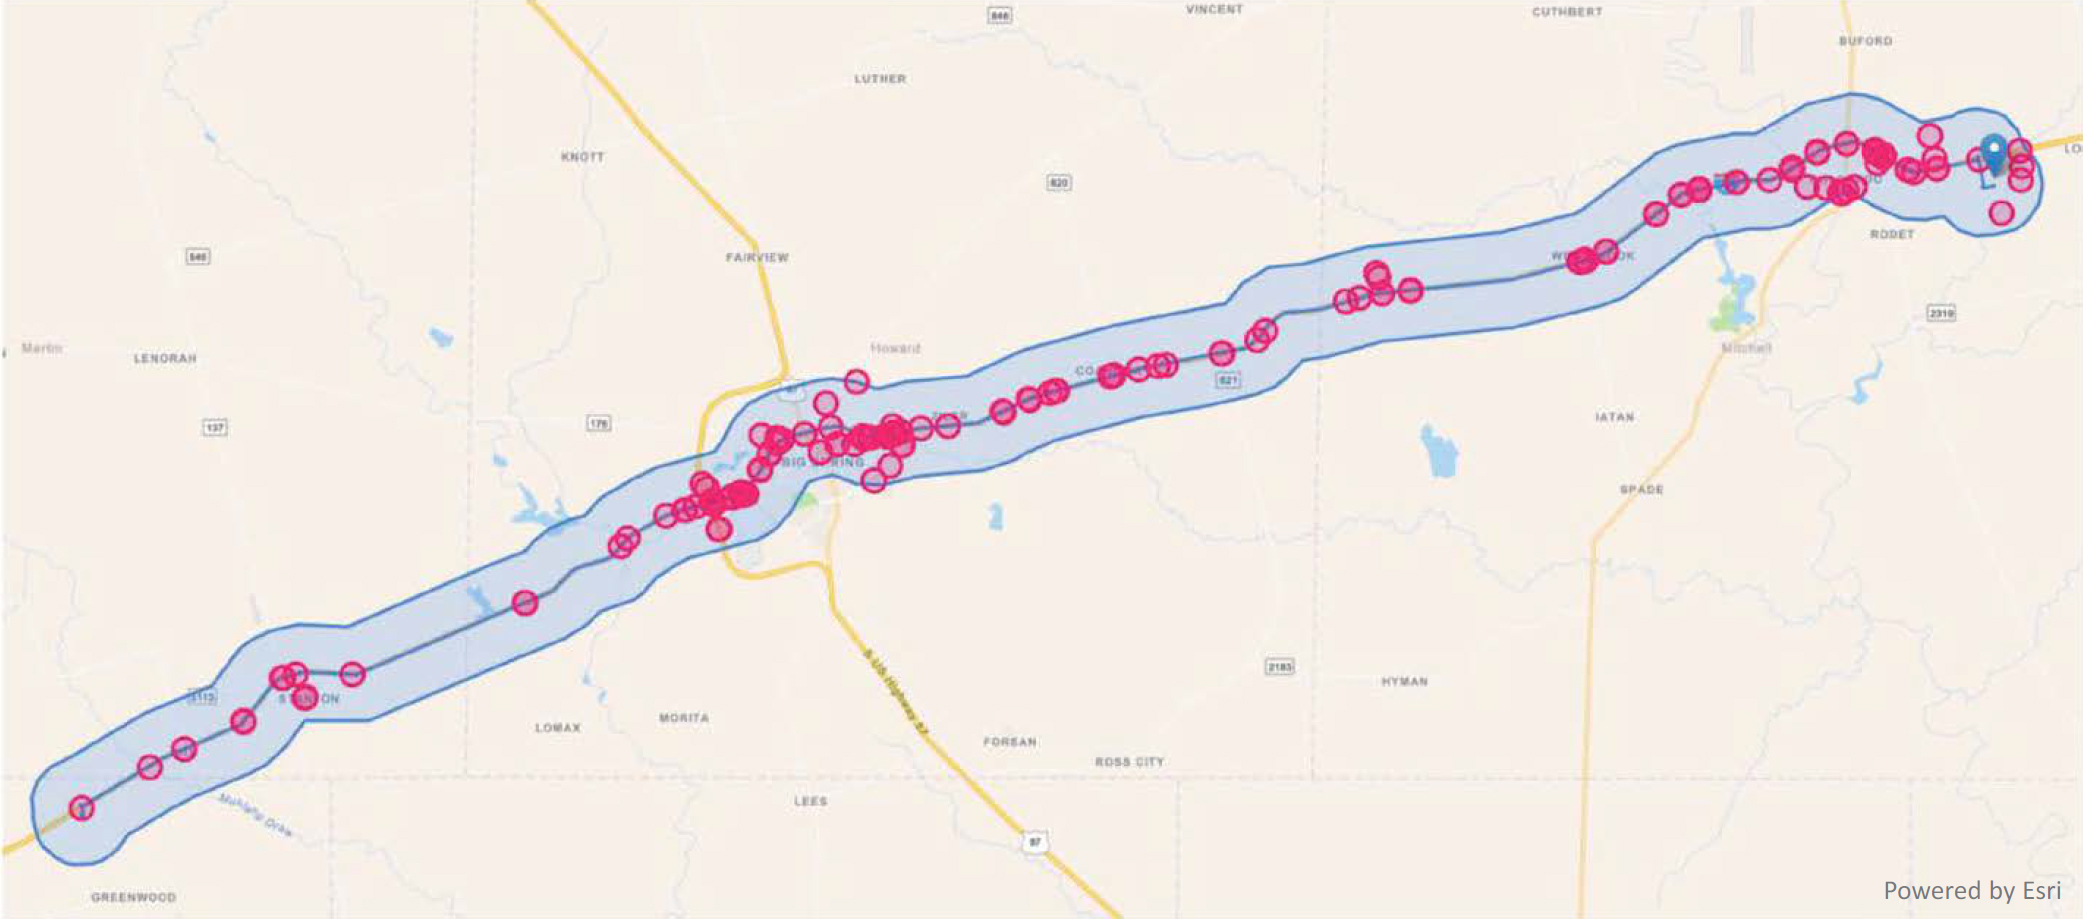
Safety Analysis
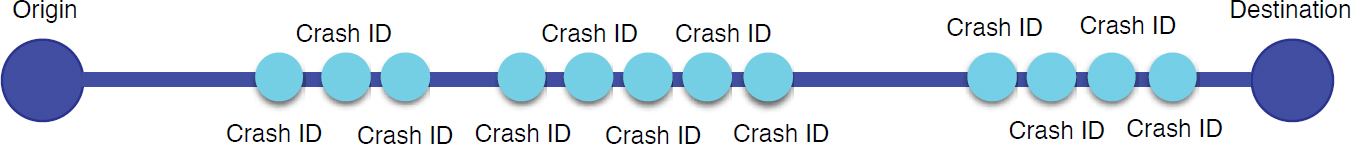
Safety analysis covers many topics, including the computation of crash rates, hotspot locations, and crash characterization (e.g., severity, manner of collision, weather conditions, time of day, surface conditions, light conditions, contributing factors). The base data requirements for most safety analyses (as represented in Figure 7-4) include
- Roadway name,
- Roadway start and end segment,
- Crash ID and location,
- Query start and end times, and
- Optional: vehicle class.
The suggested data query methodology maps the base query parameters to the respective database(s), where a control logic performs the steps for the specific analysis. The pseudocode for the control logic is as follows:
- Initialize query variables: Start Location, End Location, Start Date, Start Time, End Date, End Time.
- Optional query variables: Vehicle Class.
- Required database variables: Crash ID, Crash Location.
- Determine which datasets meet the parameters above by using the data attribute mapping summarized in Table 7-2.
- Given the Start and End Locations:
- Find routes between Start and End Locations.
- If multiple routes, enable user to select desired route.
- For the desired route, identify crash ID along that route—include buffer in search area.
- Compute desired safety analysis by using crash ID as the primary key to acquire applicable safety data attributes.
Bridge Condition and Vertical Clearance Analysis
Bridge condition assessments would typically use the National Bridge Inventory general condition ratings to describe the condition of an existing bridge or culvert. Bridges may be considered structurally deficient or functionally obsolete if they have been restricted to light vehicles, closed to traffic, require rehabilitation, or are not built to current standards. Vertical clearance data are also used to ensure bridges or structures have sufficient vertical spacing for the type of traffic using that route and to mitigate overhead collisions. Data on bridge vertical clearance are dependent on the accuracy of the DOT datasets. If the data are relatively accurate for planning purposes, the base data requirements for most bridge safety analysis (as represented in Figure 7-5) will include
- Roadway name;
- Roadway start and end segment;
- Bridge ID, location, condition, and height; and
- Optional: date.

The suggested data query methodology maps the base query parameters to the respective database(s), where a control logic performs the steps for the specific analysis. The pseudocode for the control logic is as follows:
- Initialize query variables: Start Location, End Location.
- Optional query variables: Start Date, End Date.
- Required database variables: Bridge ID (unique), Bridge Location.
- Determine which datasets meet the parameters above by using the data attribute mapping summarized in Table 7-2.
- Given the Start and End Locations:
- Find routes between Start and End Locations.
- If multiple routes, enable user to select desired route.
- For the desired route, identify Bridge ID along that route—include buffer in search area.
- Aggregate desired bridge condition and vertical clearance measures by using bridge IDs.
Pavement Condition Assessment
Pavement condition assessments are typically a combination of the distress score, which is based on visual inspection of rutting, cracking, faulting, and ride score (an automated assessment of the IRI, which is captured during the annual inspection). The condition score is used to classify pavement conditions as very good, good, fair, poor, or very poor. Condition score classifications are typically summarized by lane mile. The base data requirements for most pavement analysis (as represented in Figure 7-6) include
- Roadway name,
- Segment IDs,
- Roadway start and end segment, and
- Optional: date
The suggested data query methodology maps the base query parameters to the respective database(s), where a control logic performs the steps for the specific analysis. The pseudocode for the control logic is as follows:
- Initialize query variables: Start Location, End Location.
- Optional query variables: Start Date, End Date.
- Required database variables: Segment ID (unique).
- Determine which datasets meet the parameters above by using the data attribute mapping summarized in Table 7-2.
- Given the Start and End Locations:
- Find routes between Start and End Locations.
- If multiple routes, enable user to select desired route.
- For the desired route, determine segment IDs along that route [default to traffic message channel (TMC) segment IDs].
- For each segment ID, get the pavement condition attributes.
- Compute the desired pavement condition analysis.

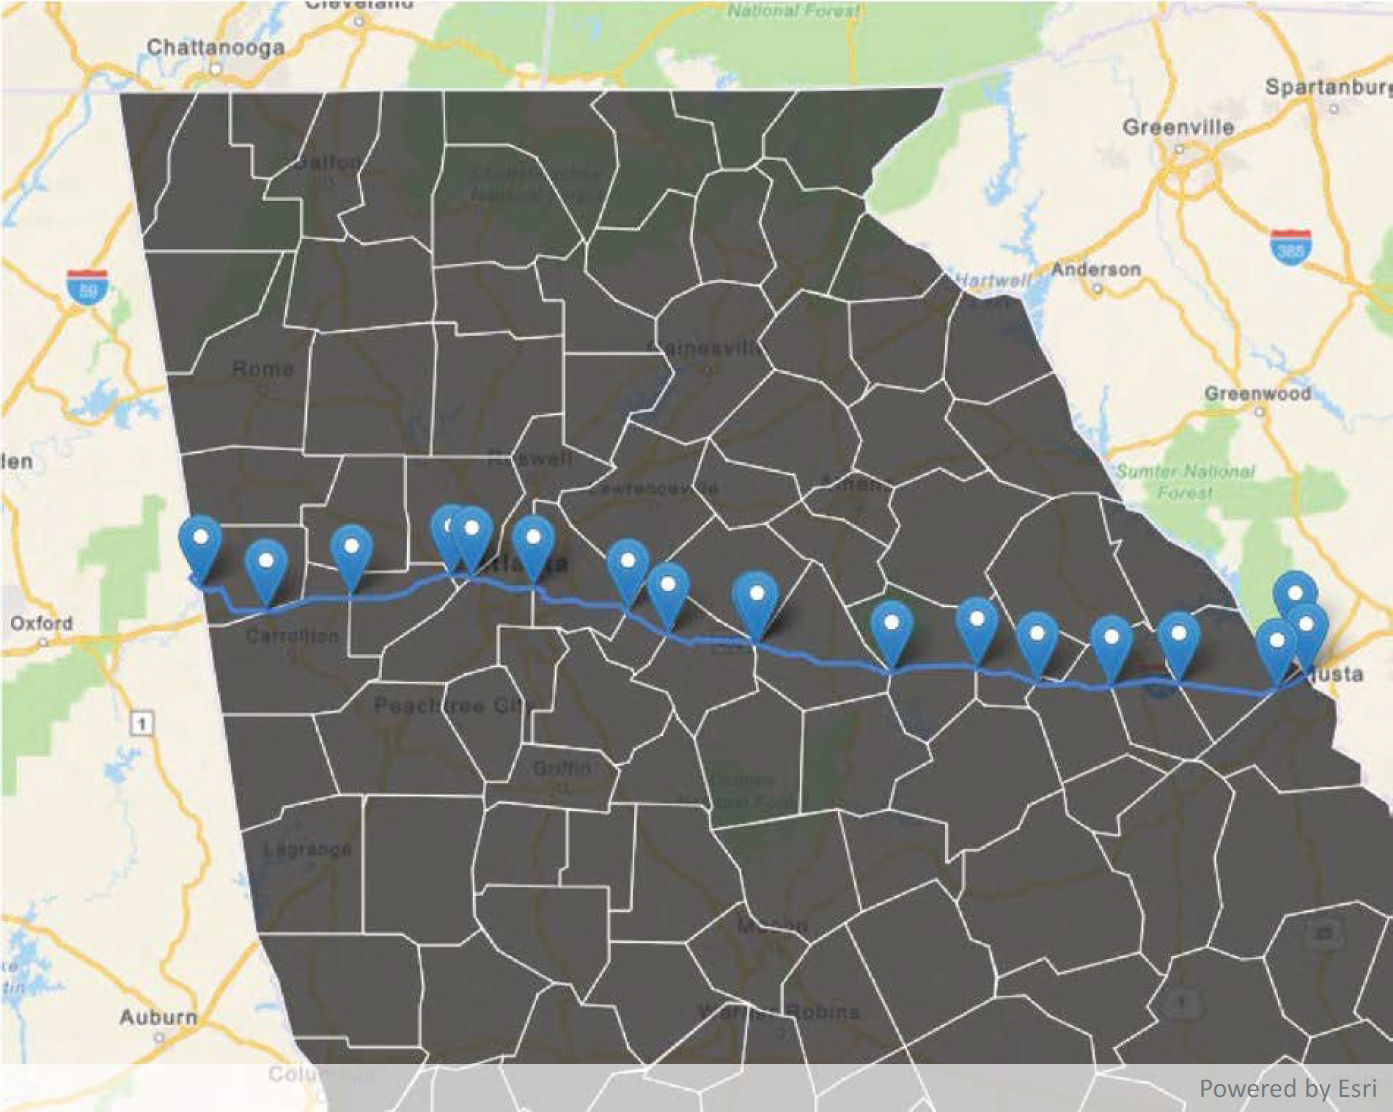
Socioeconomic Analysis
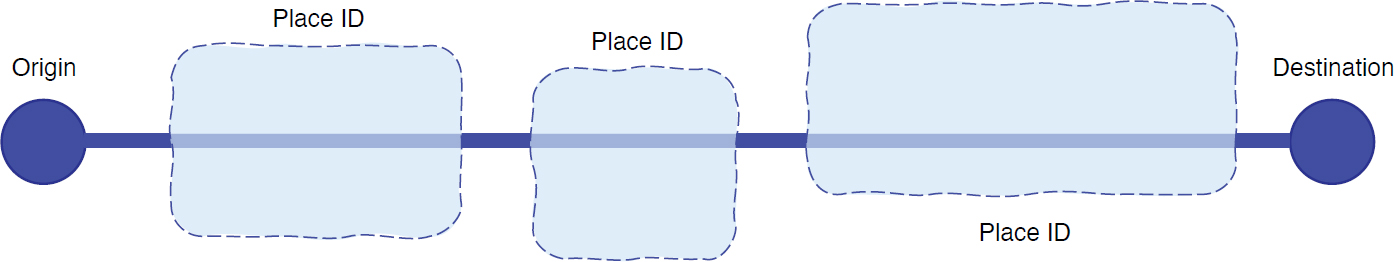
A socioeconomic analysis is defined here as the aggregation of baseline economic information, such as population, median household income, GDP, labor force trends, employment information, and location of freight generators. Data may be aggregated on the basis of the geographic extent of the location or within a well-defined proximity from a fixed object, such as the route shown in Figure 7-7. The base data requirements for baseline socioeconomic analysis include
- Place ID,
- Roads that go through the place, and
- Optional: date.
The suggested data query methodology maps the base query parameters to the respective database(s), where a control logic performs the steps for the specific analysis. The pseudocode for the control logic is as follows:
- Initialize query variables: Start Location, End Location.
- Optional query variables: Start Date, End Date.
- Required database variables: Place ID, Routes with Place IDs.
- Determine which datasets meet the parameters above by using the data attribute mapping summarized in Table 7-2.
- Given the Start and End Locations:
- Find routes between Start and End Locations.
- If multiple routes, enable user to select desired route.
- For the desired route, determine place IDs along that route based on
- Intersecting route,
- Proximity buffer from route, and
- Proximity from place where route intersects.
- For each place ID, get the desired socioeconomic attributes.
- Compute desired socioeconomic analysis.
Truck Parking Availability
Truck parking analysis involves determining the expected growth in truck activity, truck parking shortages, lack of information on truck parking opportunities, and associated challenges due to hours of service requirements and limited delivery windows. As it is a challenge to perform all these queries in a single analysis, the proposed approach examines only truck parking availability, as shown in Figure 7-8. The base data requirements for parking availability include
- Parking facility location and ID,
- Parking capacity,
- Truck volumes along the route, and
- Optional: time, day of week.

The suggested data query methodology maps the base query parameters to the respective database(s), where a control logic performs the steps for the specific analysis. The pseudocode for the control logic is as follows:
- Initialize query variables: Start Location, End Location.
- Optional query variables: Start Time, End Time.
- Required database variables: Truck Parking ID (unique), Truck Parking Location, Parking Availability Over Time.
- Determine which datasets meet the parameters above by using the data attribute mapping summarized in Table 7-2.
- Given the Start and End Locations:
- Find routes between Start and End Locations.
- If multiple routes, enable user to select desired route.
- For the desired route, identify Truck Parking IDs along that route—include buffer in search area.
- Perform query to determine truck parking capacity.
- For the selected route, perform query on truck volumes along the route and conduct estimate of truck parking demand and parking availability over time.
Custom Multiquery Analysis
There are scenarios in which multiple queries will need to be run to acquire the desired answers. For example, a DOT may want to determine the share of goods moving from a maritime port to an inner city and the subsequent impact on low-income neighborhoods. As shown in Figure 7-9, when this request is broken down, there are two queries involved.
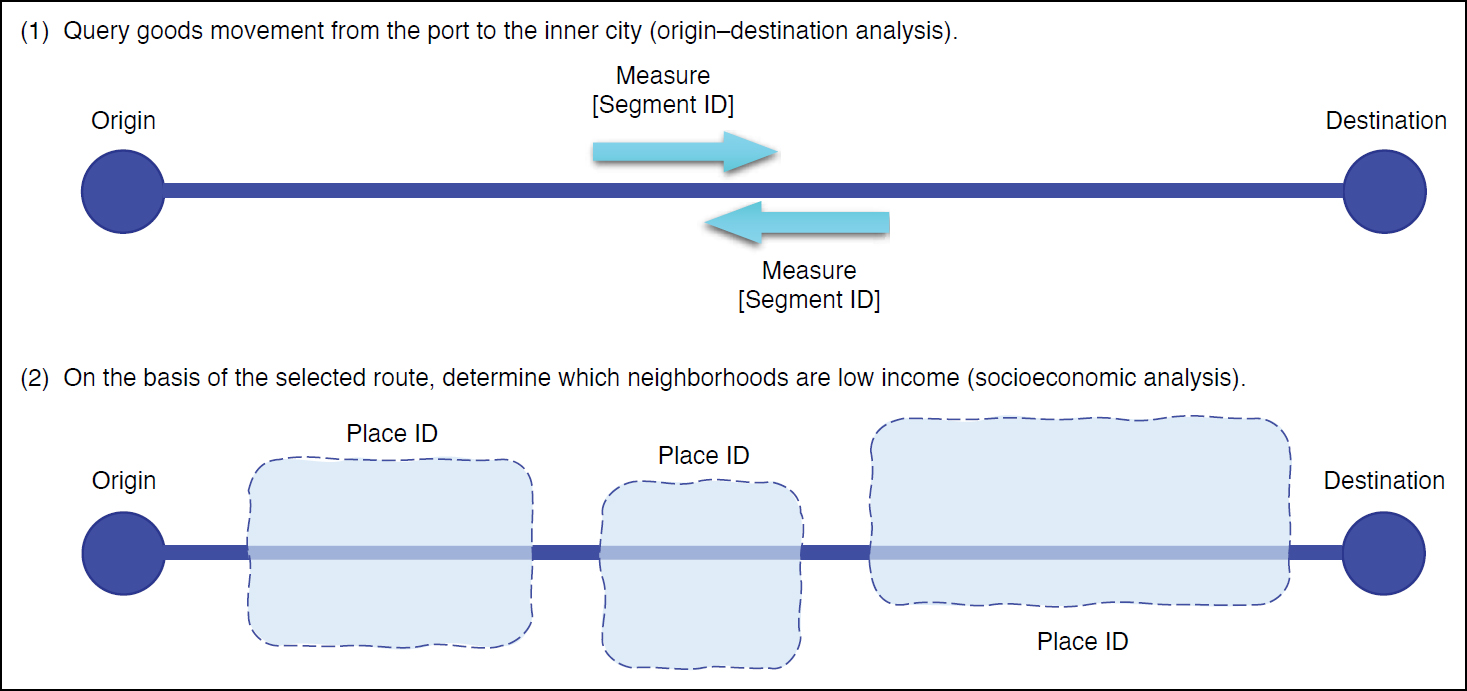
For a given route, results from the first query would be combined with the results from the second query. These two queries can be performed one after the other and the results then presented to the user.
Implementation and Results
The team developed a web-based geographic analysis and data querying tool to test the validity of the proposed methodology and use cases. The tool used web technology to test the outcome of querying multiple freight-related databases by using the base parameters (Figure 7-10) and the proposed methodology. The databases used for testing include origin–destination datasets such as Geotab, StreetLight, and INRIX; point location datasets such as those for roadway crashes and bridges; a route-based dataset such as NPMRDS; and geographic area datasets such as population data from the U.S. Census Bureau or GDP data from the U.S. Bureau of Economic Analysis.
Origin–Destination Analysis
For origin–destination analysis, predefined geographies were loaded to the web-based geospatial platform, where the user can select one or more origins or destinations, as illustrated in Figure 7-11. If a dataset contains the specified geographic locations, the dataset is selected, and the desired query results are computed. When the predefined geography submitted by the user varies from what is stored in the dataset, geolocation preprocessing can be performed to increase the likelihood of valid results being returned. For example, if the dataset stores location as zip codes or traffic analysis zones, preprocessing can be performed in which additional attributes, such as the county in which the zip code is located, are included in the dataset attributes. It is recognized that there may be slight anomalies during this data preprocessing phase; however, the user can be notified of these anomalies to assist with any additional steps that may be required.
Analysis of Safety, Bridge Condition, or Bridge Vertical Clearance
Point location data are a common variable in safety, bridge condition, and bridge vertical clearance datasets. As illustrated in Figure 7-12, point data (e.g., crash and bridge locations) along a route can be identified given a start and end route path. When the point location data are identified, the case-specific control logic can be applied. For example, upon identifying crashes along the route, crash IDs for the specific routes can be acquired, and the related crash database queried for information such as types of vehicles in each crash, cause of the crashes, time of the crashes, and roadway conditions. Parameters such as bridge vertical clearance and bridge condition are some of the queries that can be performed once a bridge is identified along a route.
Socioeconomic Analysis
Data queries for socioeconomic analysis rely on socioeconomic data (e.g., population, median household income, GDP, labor force) attributed to locations typically represented as polygons (e.g., cities, counties, custom geographic boundaries). As shown in Figure 7-13, by setting the start and end route locations, data attributes from polygons that intersect the desired route can be queried. The case-specific control logic is then applied. Furthermore, start and end locations can be an entire state, county, or region without the need for a route to be selected.
Conclusion, Recommendations, and Next Steps
This chapter illustrates the use of a few parameters to query multiple freight datasets to address various use cases. Location, time, and vehicle class were selected as the minimum parameters sufficient for querying most datasets, after which a user can perform additional operations for a specific use case. These parameters and a commonly accepted routing network form the foundation of an interoperable freight data architecture.
For most location-based queries, vendors can agree on the Census Bureau’s geographic entity definitions with accommodation for custom locations that are transferable between vendors—for example, by using GeoJSON-defined polygon geometries. Users can also set the start and end locations to be in the same location if the queries pertain to one location—for example, socioeconomic parameters such as population, GDP, and median income, among others.
Other parameters present challenges, such as vehicle class and routing. Some challenges are addressed through the query-mapping recommendations. For vehicle classification, mapping vehicle weights with vehicle axle counts will continue to be challenging, given the way the data are currently collected. Cautionary inferences need to be made when comparative analysis results regarding vehicle classification from multiple data sources are being reported. Regarding the routing, a shift toward an open roadway network such as OpenStreetMap would be beneficial
in the long term. However, the approach developed for LinkerAT (see Chapter 14) provides an opportunity to cross-reference different street network maps.
Potential next steps include developing a complete web-based application using the methodologies developed from this study and enhancing the recommendations provided through further testing of additional use cases.
References
Asborno, M. I. (2020). Commodity-Based Freight Activity on Inland Waterways Through the Fusion of Public Datasets for Multimodal Transportation Planning. Graduate Theses and Dissertations. Fayetteville, AR: University of Arkansas, Fayetteville. Retrieved Oct. 20, 2023, from https://scholarworks.uark.edu/cgi/viewcontent.cgi?article=5310&context=etd.
Bauer, C., and Purdy, J. (2017). Dynamic Data Fusion: Mining Private Sector Relationships and Public Databases to Enhance and Predict Freight Movement. Washington, DC: U.S. Department of Transportation, FHWA. Retrieved Oct. 20, 2023, from https://ops.fhwa.dot.gov/publications/fhwahop17012/index.htm.
Camargo, P., Hong, S., and Livshits, V. (2017). Expanding the Uses of Truck GPS Data in Freight Modeling and Planning Activities. Transportation Research Record: Journal of the Transportation Research Board, 2646(1):68–76. https://doi.org/10.3141/2646-08.
Daneshgar, F., Sadabadi, K. F., and Haghani, A. (2018). A Conflation Methodology for Two GIS Roadway Networks and Its Application in Performance Measurements. Transportation Research Record: Journal of the Transportation Research Board, 2672(45):284–293. https://doi.org/10.1177/0361198118793000.
Eluru, N., Li, X., Pinjari, A., Abdel-Aty, M., Anowar, S., Momtaz, S. U., Iraganaboina, N. C., Keya, N., Dey, B., Zhao, D., Balusu, S., and Sheela, P. V. (2018). Freight Data Fusion from Multiple Data Sources for Freight Planning Applications in Florida. Tallahassee: Florida Department of Transportation. https://rosap.ntl.bts.gov/view/dot/36207.
FHWA. (2016). Highway Performance Monitoring System Field Manual. Washington, DC: U.S. Department of Transportation. https://www.fhwa.dot.gov/policyinformation/hpms/fieldmanual/page05.cfm.
FHWA. (2022). Traffic Monitoring Guide. Appendix C: Vehicle Types. Washington, DC: U.S. Department of Transportation. https://www.fhwa.dot.gov/policyinformation/tmguide/tmg_2013/vehicle-types.cfm.
Hernandez, S., and Hyun, K. (2020). Fusion of Weigh-in-Motion and Global Positioning System Data to Estimate Truck Weight Distributions at Traffic Count Sites. Journal of Intelligent Transportation Systems, 24(2): 201–215.
Lasley, P., Lomax, T., Jha, K., Schrank, D., Eisele, B., and Venditti, C. (2021). The Keys to Estimating Mobility in Urban Areas. Technical White Paper. College Station, TX: Texas A&M Transportation Institute. Retrieved Oct. 20, 2023, from https://static.tti.tamu.edu/tti.tamu.edu/documents/TTI-2021-3.pdf.
Mejia, D., Villanueva-Rosales, N., Torres, E., and Cheu, R. L. (2017). Integrating Heterogeneous Freight Performance Data for Smart Mobility. 2017 IEEE SmartWorld, Ubiquitous Intelligence & Computing, Advanced & Trusted Computed, Scalable Computing & Communications, Cloud & Big Data Computing, Internet of People and Smart City Innovation, Aug. 4–8, 2017, San Francisco, CA, pp. 1–8.
Seedah, D. P., Choubassi, C., and Leite, F. (2016). Ontology for Querying Heterogeneous Data Sources in Freight Transportation. Journal of Computing in Civil Engineering, 30(4). https://doi.org/10.1061/(ASCE)CP.1943-5487.0000548.
U.S. Department of Energy. (n.d.). Alternative Fuels Data Center, Maps and Data, Vehicle Weight Classes & Categories. https://afdc.energy.gov/data/10380.
Walton, C. M., Seedah, D. P. K., Choubassi, C., Wu, H., Ehlert, A., Harrison, R., Loftus-Otway, L., Harvey, J., Meyer, J., Calhoun, J., Maloney, L., Cropley, S., and Annett, F. (2015). NCFRP Report 35: Implementing the Freight Transportation Data Architecture: Data Element Dictionary. Washington, DC: Transportation Research Board. https://www.nap.edu/catalog/21910/implementing-the-freight-transportation-data-architecture-data-element-dictionary.
You, L., Zhao, F., Cheah, L., Jeong, K., Zegras, P. C., and Ben-Akiva, M. (2020). A Generic Future Mobility Sensing System for Travel Data Collection, Management, Fusion, and Visualization. IEEE Transactions on Intelligent Transportation Systems, 21(11):4149–4160.
Zhang, X., and Chen, M. (2023). Methodology for Conflating Large-Scale Roadway Networks. Transportation Research Record: Journal of the Transportation Research Board, 2677(3):189–202. https://doi.org/10.1177/03611981221115085.


