Enhancing Airport Access with Emerging Mobility (2025)
Chapter: 4 Inventory of Emerging Modes and Technologies
CHAPTER 4
Inventory of Emerging Modes and Technologies
Purpose
This chapter provides an overview of existing and emerging transportation modes and technologies relevant for airport ground access. It documents the state-of-the-art modes and technologies relevant to airport ground access, as well as their benefits and performance. Also, it provides estimated timelines for their implementation and information on potential consumer adoption.
Catalog of Modes and Technologies
Figure 23 lists modes and technologies that are relevant to airport access. In this “wheel of airport access,” modes of transportation are first grouped by media or type of track. The first-level categories are micromobility (1–2), guided transportation systems (3–11), air and water (non-ground) mobility (12–15), and non-guided transportation systems (16–22). Modes are then grouped by technology and level of automation, and an example of a practical application is also provided.
This categorization is followed throughout the report. When different modes within the same group have similar characteristics or share other aspects, they are presented together to prevent repetition.
The terminology used in this report is primarily based on federal laws and regulations as well as industry standards (e.g., ASTM and SAE International). For emerging technologies that are not yet covered by official terminology, the most common term within the transportation community is used, as long as it is inclusive of all ongoing efforts and not a brand or proprietary term for a particular product. Also, legacy concepts that are being revisited are not given their own categories; for example, vactrains (e.g., hyperloops) fall under the magnetic levitation (maglev) category (11).
As far as practicable, common terms and definitions associated with each mode are presented. When two terminologies conflict, or when a definition can be confusing, priority is given to the clarity of the narrative in the context of airport access. For instance, 49 U.S. Code (U.S.C.) § 5302 defines fixed guideway as a public transportation facility using and occupying a separate right-of-way for the exclusive use of public transportation via rail, a fixed catenary system, a passenger ferry system, or a bus rapid transit (BRT) system. For this report, neither BRT nor ferry and BRT systems are considered guided systems, given their operational flexibility of not being restricted to guideways.
Transportation modes and technologies are constantly evolving. The wheel of airport access in Figure 23 features at least one hybrid mode that falls under two different second-level categories (e.g., ground-effect vehicles [GEVs] are simultaneously aircraft and vessels). Also, some novel
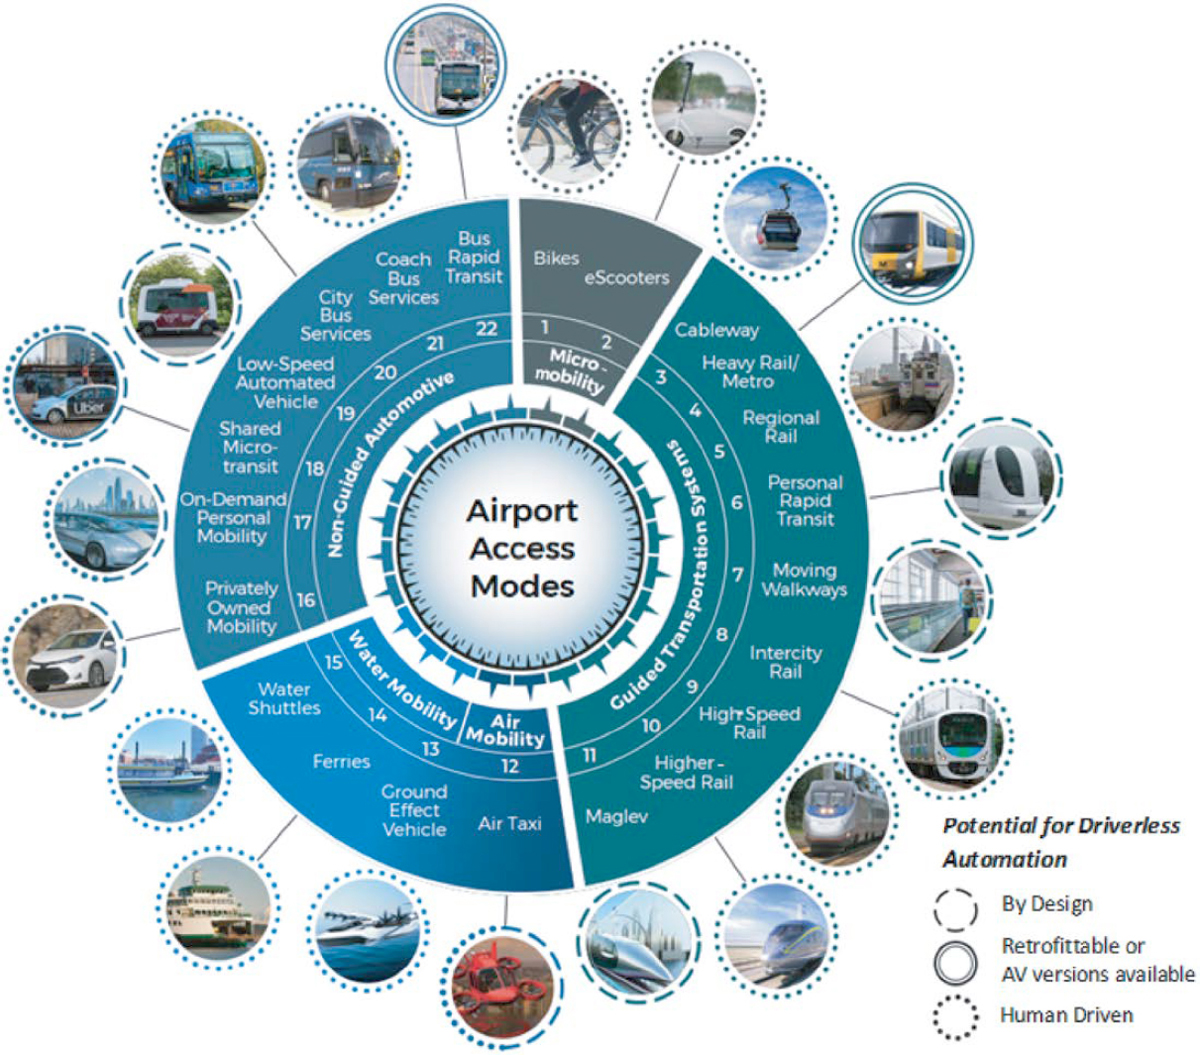
concepts may not strictly follow this proposed categorization. For instance, the Flexy concept of French railway operator Société Nationale des Chemins de fer français (SNCF) suggests a new class of vehicles, seating up to 14 passengers and moving at up to 37 mph, that could operate on low-traffic rural railways and then leave the tracks at designated locations to turn into an automated vehicle on roadways for the first and last miles (FLM). Such vehicles may fall under categories 5 and 19 of the wheel of airport access graphic. The Swiss project Cargo Sous Terrain would build a network of underground tunnels connecting urban centers with logistic hubs—including Zurich International Airport (ZRH). Electric pods would carry freight at up to 20 mph. Such a system combines features from metrorail (4), personal rapid transit (PRT) (6), and low-speed automated vehicles (LSAVs) (19). The personal gondola transportation network
Halfgrid, proposed by Half Company in Bulgaria, has features of both cableway systems and PRT systems (3 and 6). The subterranean car and pod conveyor Loop of the Boring Company adopts characteristics from both categories 6 and 11. In ACRP Project 10-33, this particular technology is referred to as personal maglev transit.
Micromobility
Definitions
According to the FTA, micromobility is a diverse transportation mode that provides flexibility and choices, including public transit, bikeshare, ride-hailing, e-scooters, and microtransit. FHWA broadly defines micromobility as any small, low-speed, human- or electric-powered transportation device, including bicycles, scooters, electric-assist bicycles, e-scooters, and other small, lightweight, wheeled conveyances (Price et al. 2021). Walking is not considered to be a component of micromobility.
Consequently, micromobility includes both active transportation (human-powered mobility) as well as the use of slow and light personal-powered vehicles. SAE International’s (2019) Taxonomy and Classification of Powered Micromobility Vehicles defines powered micromobility vehicles as “a category of powered vehicles that have a curb weight of less than or equal to 500 pounds (227 kilograms) and a top speed of 30 miles per hour (48 kilometers per hour) or less.” This excludes most golf carts due to their weight—typically ranging from 800 to 1,200 pounds—but includes, for instance, any lighter four-wheelers falling under the low-speed vehicle category per 49 CFR § 571.3.
While these definitions do not explicitly exclude small vehicles with internal combustion engines (ICEs) (e.g., mopeds), the scope of micromobility is sometimes reduced to only human- and electric-powered devices, as well as devices that can occupy space alongside bicycles. For instance, the Institute for Transportation and Development Policy uses micromobility to refer to a range of small, lightweight devices operating at speeds typically below 25 kilometers per hour (km/h) and not exceeding 45 km/h that are either human- or electric-powered and privately owned or shared. Such an approach can be useful for policy purposes to promote or regulate the use of zero-emissions two-wheelers.
However, jurisdictions often use the term “electric bicycle” (e-bike) to represent micromobility. For example, the California Vehicle Code (CVC) defines an e-bike as “a bicycle equipped with fully operable pedals and an electric motor of less than 750 watts.” Similarly, 16 CFR § 1512.2(a) defines a bicycle as a two-wheeled vehicle having a rear drive wheel that is solely human-powered or “with fully operable pedals and an electric motor of less than 750 watts (1 hp), whose maximum speed on a paved level surface, when powered solely by such a motor while ridden by an operator who weighs 170 pounds, is less than 20 mph.”
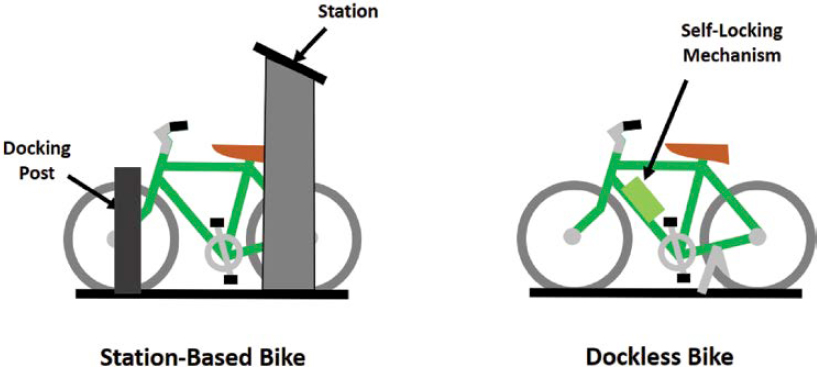
There are two types of shared bikes: docked and undocked. Docked bikes require designated stations for pick-up and return, while undocked bikes offer more flexibility, allowing users to start and end their rides at various locations. Figure 24 depicts the differences between the two types of shared bikes.
The City of San Francisco was among the first U.S. cities to see the development of micromobility and shared-bicycle options. JUMP, a company that manages bikeshare operations, launched its operation of 250 e-bikes in 2018 as part of an 18-month trial program. A similar micromobility alternative in the United States can be seen in Santa Monica, CA, through one of the largest e-scooter operators, Bird, which started around 2017.
Capacity and Speed
Most micromobility vehicles are designed for a single rider capacity, with some cargo e-bikes or bike cars designed to accommodate multiple riders. According to the International Transport Forum, micromobility is defined as: “the use of vehicles with a mass of less than 350 kg and a design speed of 45 km/h or less,” which is equivalent to a speed of 28 miles per hour (mph).
The National Association of City Transportation Officials (NACTO) (2019a) recommended the following speed limitations for micromobility in spaces with high pedestrian utilization:
- Unrestricted: 15 mph.
- Slow zone: 5–12 mph.
- Nonelectric vehicle: 0–3 mph.
- Prohibited spaces: User must walk their vehicle.
Figure 25 provides an overview of various micromobility vehicles along with characteristics for each on weight, capacity, power supply, and speed.
Stakeholder Ecosystem
Cities may have contracts with operators for e-bikes and e-scooters—such as JUMP and Bird, respectively—to run local shared micromobility systems. Operators under contract may have exclusivity to operate, limiting the municipalities’ ability to provide permits for additional operators within the city. More specifically, city and state departments of transportation (DOTs) and the department of public works have authority over street space and how it is used. Through regulating shared micromobility in a city and establishing permits with operators, these entities can specify terms such as fleet size, location of stations and parking docks, and equitable distribution of resources for communities.
While cities have taken various approaches to managing shared micromobility on their streets through the implementation of pilot programs and permits, there are multiple stakeholders involved in the micromobility ecosystem. National organizations, such as the North American Bikeshare & Scootershare Association (NABSA) and NACTO, also play a significant role in the micromobility ecosystem by providing resources, guidelines, and advocacy for the shared micromobility industry.
The users of micromobility services at airports are also key players in the stakeholder ecosystem. Users are not limited to the general traveling public; they can also include airport employees
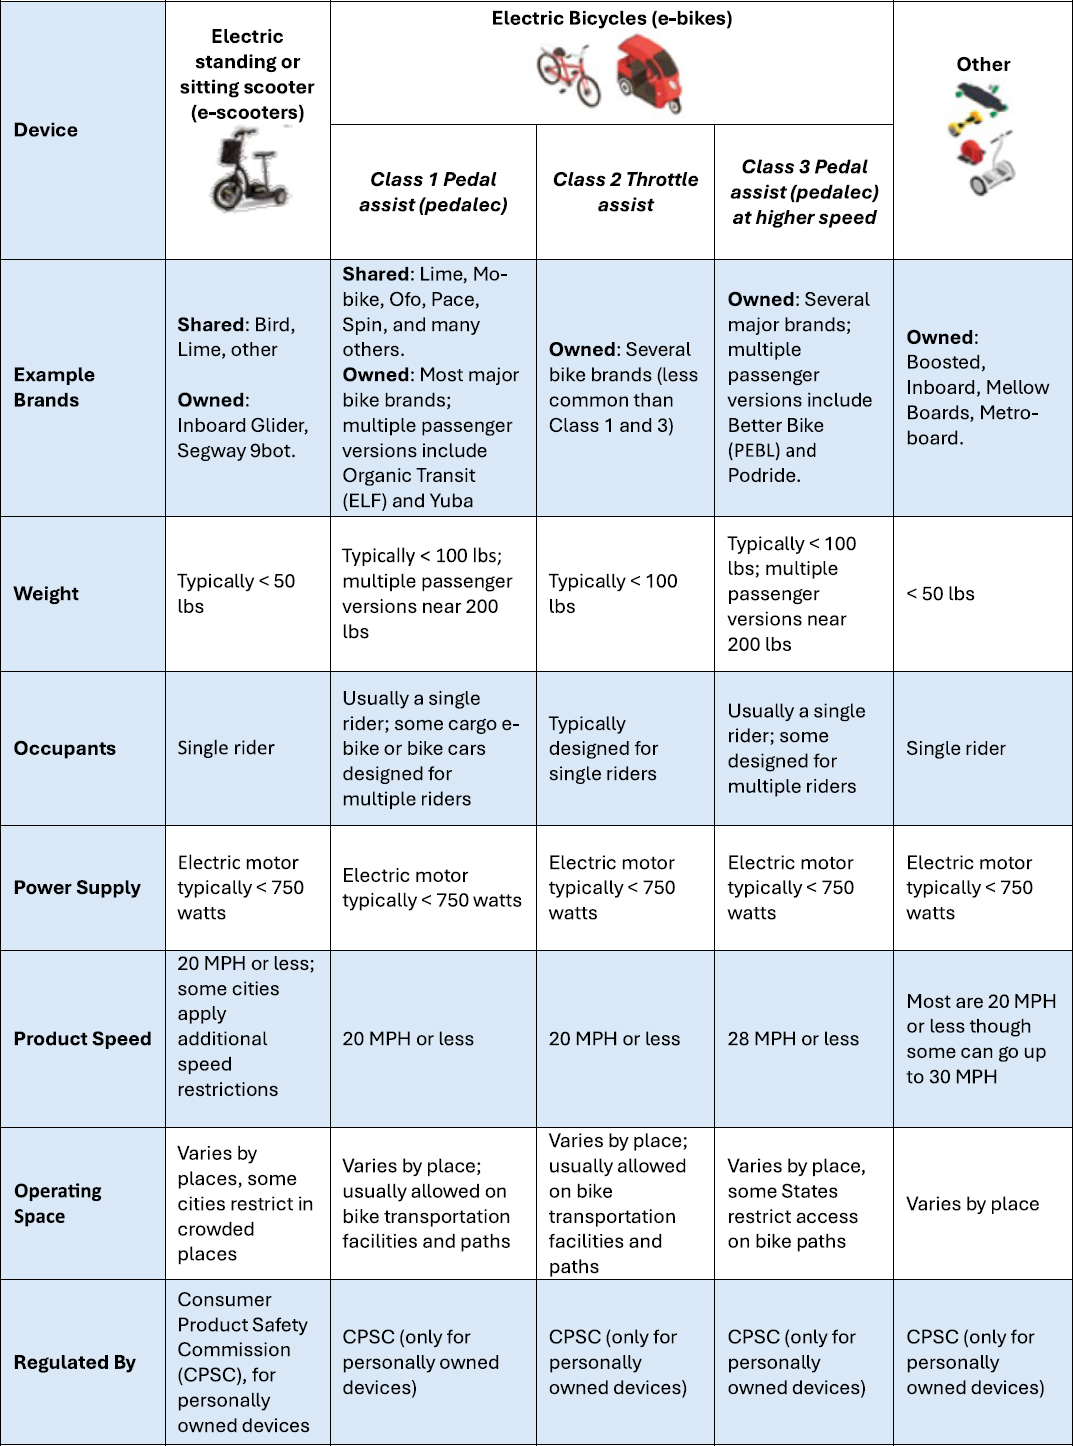
Source: Sandt (2019), adapted by WSP
Note: The basics of micromobility and related motorized devices are for personal transport.
who use private or shared micromobility to commute daily to work or use micromobility as a last-mile intermodal connection to other transit systems to access the airport.
Current Trends
NABSA’s 2021 Shared Micromobility State of the Industry Report reported that scooters represent 57 percent of the total number of shared micromobility vehicles in operation across North America and that 50 percent of bikeshare systems now include e-bikes, which are ridden approximately 36 percent more than regular pedal bikes. Additionally, the report included statistics on the purpose of using microvehicles—for example, in 2021, 63 percent of riders stated that they use shared micromobility to connect to transit, and 18 percent say they use it weekly for the purpose of connecting to transit (North American Bikeshare & Scootershare Association 2022).
The significant adoption of e-scooters and e-bikes is leading cities and transportation officials to rethink urban spaces and redesign streets and existing infrastructure to make it safer for commuters and encourage a greater mode shift from personal vehicles to shared micromobility. One concept that cities have been talking about is micromobility lanes, in which existing striped lanes or protected bike lanes (PBLs) with physical barriers can be used for any form of micromobility, since scooters tend to not mix well with cars or high-density pedestrian traffic.
City officials are also working on several mobility goals. For example, in Milwaukee, WI, there is great emphasis on providing widespread access and integrating micromobility not just in dense, urban areas but also spread throughout the city so that more neighborhoods have access to micromobility services.
Following an initial surge that caught many off guard and spurred a proliferation of competitors, the micromobility sector has undergone a consolidation. This has resulted in a reduction in the number of competitors.
Implementation and Consumer Adoption
Micromobility has multiple benefits, such as providing an FLM solution, reducing air pollution, and offering affordable, personal transport. Bicycles and e-scooters can increase the accessibility of other modes as well, offering a cost-efficient way to access mass transit options that may not be available at the doorstep. Privately owned bicycles have existed for over a century, but several factors have limited their broader adoption in the United States. A major obstacle is the footprint of many U.S. cities and the consequently long trip distances that are incompatible with the extensive use of bicycles. Also, there is a lack of adequate bike-friendly infrastructure in many communities. In many cities around the world, the implementation of bike-friendly policies, the creation of bikeway networks that provide PBLs, and the emergence of an ecosystem of bicycle maintenance and repair shops is boosting bike utilization for short trips.
Alternatively, modern micromobility services propose a convenient way to commute over relatively short distances (up to about 5 miles or roughly 10 kilometers) with on-demand electric devices. Micromobility providers make the bicycles available across the city, take care of battery charging, and provide maintenance and repair. While local governments initially struggled to regulate this mode, best practices are now in place. Governments have enacted and enforce e-scooter parking areas, as well as traffic safety rules (e.g., mandatory safety helmet).
In 2018, JUMP, a company that launched operation of 250 e-bikes as part of a year-and-a-half trial program, covered the main areas of San Francisco, California. Santa Monica, California, is the birthplace of Bird, one of the largest e-scooter operators, which started operating around 2017. Bird offers free helmets and introduces the Save our Sidewalks pledge to encourage users to park responsibly. Micromobility services are now available throughout the United States, primarily in large- and medium-sized metropolitan areas, as shown in Figure 26.
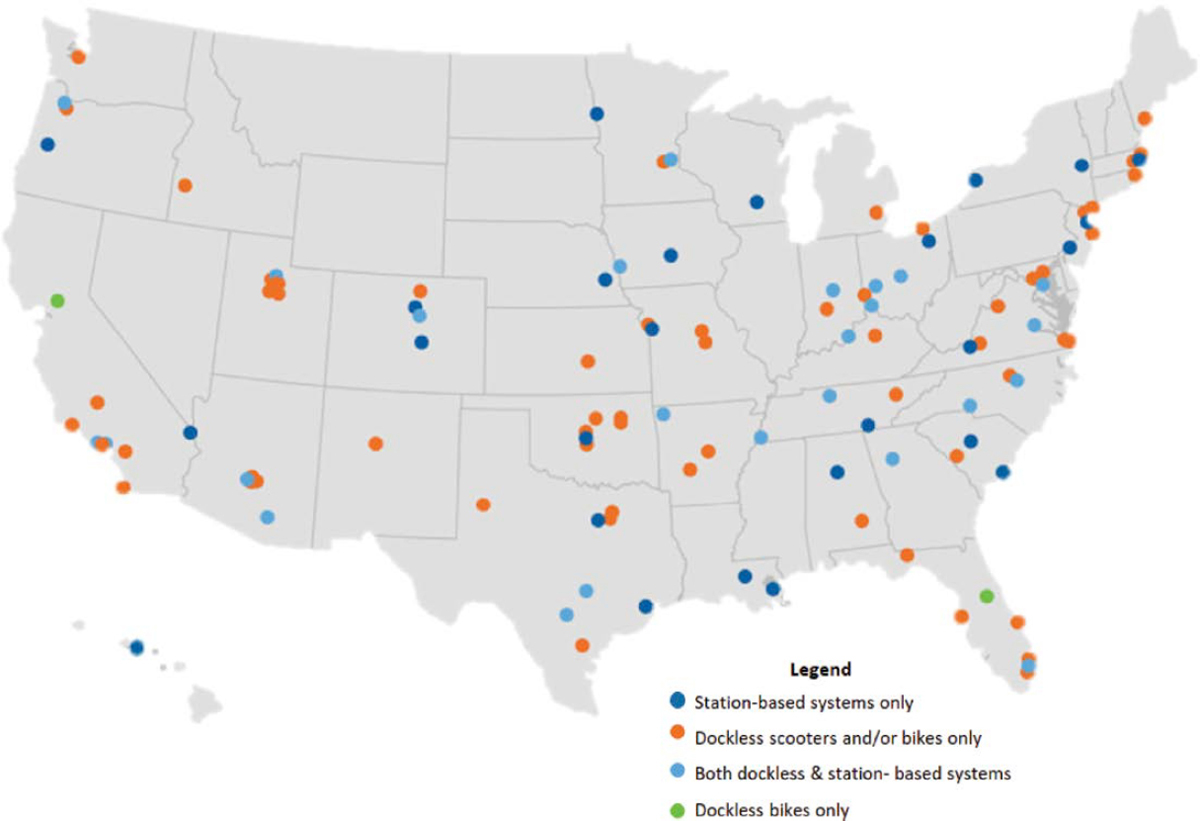
Source: National Association of City Transportation Officials (2019b)
Moving Walkways
Definition
A moving walkway—also known as a moving sidewalk, people mover, or travelator—is defined in ASME A17.1 as “a type of passenger-carrying device on which passengers stand or walk, and in which the passenger-carrying surface remains parallel to its direction of motion and is uninterrupted” (American Society of Mechanical Engineers 2019). Pedestrians can stand or walk on the conveyor belt or pallets. Moving walkways are often installed in pairs to provide a two-way transportation system. Their speed is typically less than 3 mph (5 km/h) for safety purposes. While higher speeds are technically possible, more frequent balance issues and falls from users with impaired mobility have been observed on conveyors running at more than 5 mph (8 km/h).
Applications
Moving walkways can be found at large facilities that accommodate the public, such as airports, subway stations, and ground transportation centers (GTCs). The slow-moving conveyor mechanism transports people over short to medium distances, and people can either stand or walk on them. To accelerate mobility and reduce congestion, several cities have developed or
implemented moving walkways, which efficiently transport people from one point to another within urban areas:
- For the Exposition Universelle of 1900, Paris hosted a moving walkway to transport people across a route of 2.5 miles. The walkway was implemented on a 7-meter-high metal viaduct with nine stations, and it transported nearly 7 million visitors.
- In the 1960s, Sydney, Australia, opened the Domain Express Walkway, an underground tunnel equipped with two moving walkways in the city’s downtown.
- In 1993, Hong Kong developed a Central–Mid-Levels escalator and walkway system, which is the longest covered escalator or walkway system in the world at 2,600 feet long.
- Santander or Vitoria in Spain also implemented outdoor moving walkways to facilitate pedestrian traffic, as depicted in Figure 27.
Current moving walkway technologies have the capacity to move up to 7,500 passengers/hour with top speeds of 10 mph, according to Scarinci et al. (2017). Scarinci et al. estimated that creating a mass transit system of moving walkways in dense urban areas is feasible but would require both a vehicle-free city and the replacement of vehicular traffic lanes with moving walkways. However, several barriers to the implementation of long, urban moving walkways have been identified: the architecture of the city, high capital and operating costs, and acceptance of the system by residents.
Between 2002 and 2011, an experimental high-speed moving walkway was in operation at the Montparnasse-Bienvenüe metro station in Paris, France. The Trottoir Roulant Rapide could move at 7 mph (11 km/h), while traditional walkways have a travel speed lower than 5 mph. The initial acceleration made the walkway unsuitable for people with impaired mobility, and users were required to have at least one hand free to hold the moving handrail.
Moving Walkways and Airports
Moving walkways are useful tools for alleviating long walking distances for passengers inside terminal buildings and between components of the terminal area (e.g., from the parking garage or transportation center to the terminals) or facilitating transfers between different segments of the journey on the FLM. Guidelines are provided later in this report for decision-making on the installation of moving walkway equipment with regard to the travel distance and time (see Chapter 13).
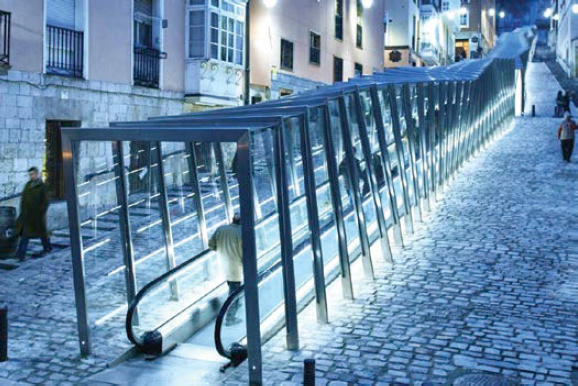
Source: Lanssens (2020)
While higher-speed moving walkways are sometimes presented as an urban mobility alternative, concerns over accessibility for disabled users, high capital and operating costs, as well as availability have made this specific use case a niche, with a few high-grade streets around the world equipped with such systems (École Polytechnique Fédérale de Lausanne 2016). The primary urban application of moving walkways remains the facilitation of transit along long corridors in underground facilities (e.g., metro stations), connectors and corridors, as well as large, public venues.
Although there are no specific regulations for outdoor moving walkways in the United States, existing regulations for buildings—such as 29 Code of Regulations (CFR) 1917.116: Elevators and Escalators and ASME’s handbook A17.1-2019: Safety Code for Elevators and Escalators—could be adapted for street application. New ground-level, or potentially underground, moving walkways could share the same space next to pedestrian sidewalks and could connect airports to city centers.
Public Bus
Definition
The FTA defines a bus as “a rubber-tired automotive vehicle used primarily for the purpose of providing mass transportation service” (Federal Transit Administration 2016b). Buses are one of the most flexible and least expensive modes when it comes to expanding and reorganizing transportation networks, especially when compared to subway systems (Aravena et al. 2013).
The bus system provides scheduled services between designated stops, and it is the most common form of mass public transportation. In the 2019 American Community Survey, 46.3 percent of public transportation commuters reported using buses as their primary mode of transportation during that year, which represents 2.3 percent of the U.S. working population (Burrows et al. 2021).
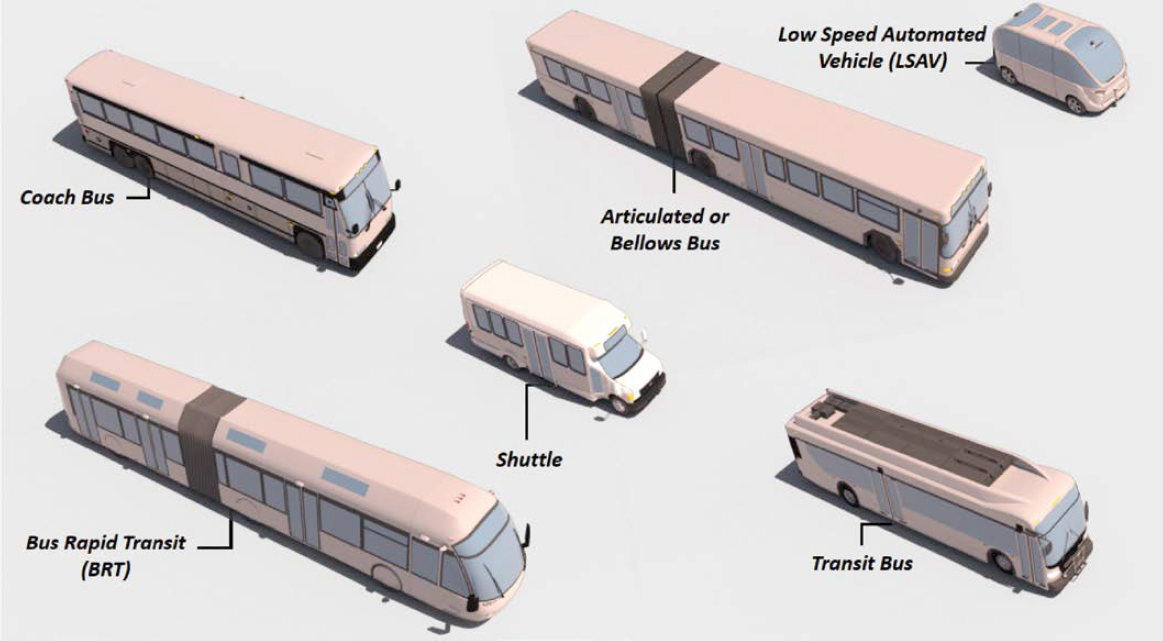
Buses come in different types, each designed for specific purposes. Six main types of bus can be identified, as depicted in Figure 28:
- Transit bus: The most common bus type, also called a city bus, is used for public transportation within urban areas. These buses typically are about 40 feet long and have seating for approximately 30 passengers, and they often feature standing room.
- Articulated or bellows bus: This type of bus, also used within urban areas, is divided into two or more sections that are connected by flexible joints. These joints, often referred to as “articulations,” allow the bus to bend and articulate; this makes it longer and gives it a larger capacity than a transit bus. The most common design includes a hinge or accordion-like section in the middle of the bus, which facilitates maneuvering through city streets.
- Bus rapid transit: This type of bus is used for public transportation (see definition in the section of this chapter on BRT).
- Coach bus: This type of bus is used for long-distance travel. Coach buses are usually larger than transit buses; they offer comfortable seating, air conditioning/heating, and other amenities like free Wi-Fi; and there is a luggage compartment under each bus. Unlike transit buses, coaches only operate between intercity bus terminals.
- Shuttle: This type of bus is commonly used for short-distance journeys, such as airport transfers, hotel shuttles, and parking lot shuttles. Shuttles are typically between 25 and 35 feet long and offer less capacity than transit or coach buses, but they include air conditioning/heating, luggage compartments, and wheelchair accessibility.
- Low-speed automated vehicles: The low-speed automated vehicle (LSAV) can operate as public transportation and offer shared mobility services. In its technical report Low-Speed
-
Automated Shuttles: State of the Practice (Cregger et al. 2018), U.S. DOT defines this new category of automated vehicle (AV) with the following features:
- – Fully automated driving without a driver on board. It corresponds to the SAE Level 4 automation. (SAE’s levels of driving automation are described in Chapter 5.)
- – LSAVs are intended for protected and less complicated environments.
- – LSAVs are limited to 25 mph, with cruising speeds around 10 to 15 mph.
In 2018, the report estimated more than 260 LSAV demonstrations around the world and identified more than 50 suppliers of LSAVs in different stages of development. The first commercial deployment of LSAVs in the United States was launched in Detroit, Michigan, in July 2018 by a commercial real estate firm to provide its employees with connections from their offices to remote parking downtown.
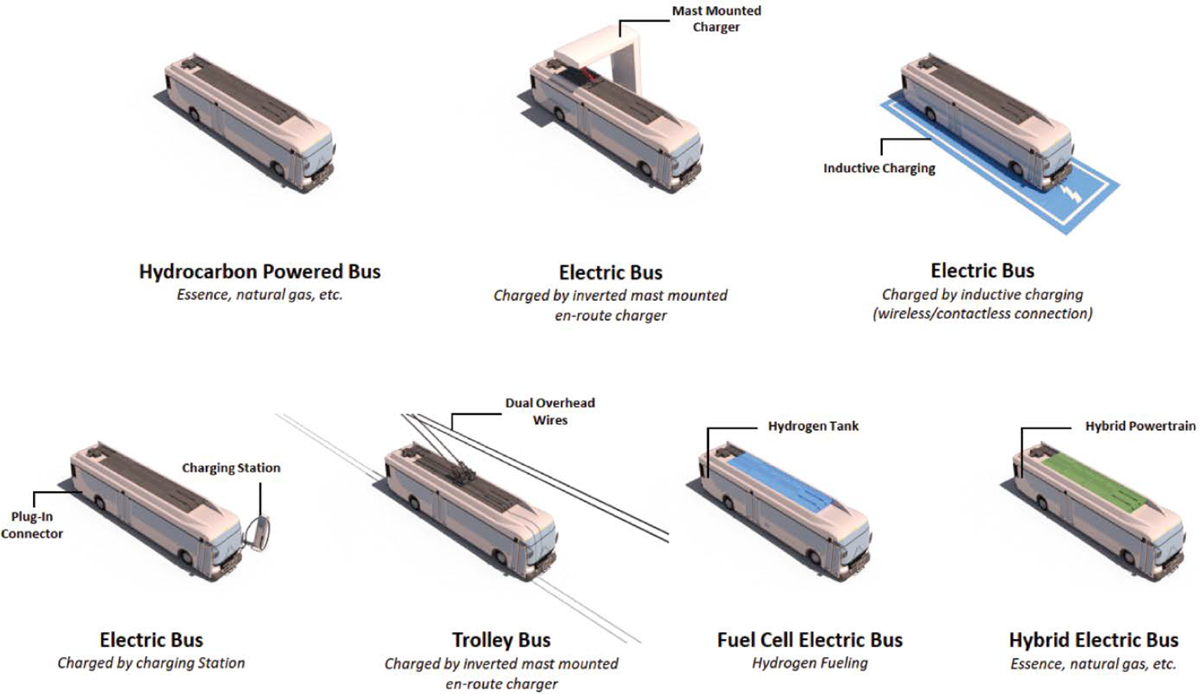
Buses come in various configurations and power sources, as shown in Figure 29, with each contributing to diverse and sustainable urban transportation:
- Hydrocarbon-powered buses use an ICE powered by natural gas, propane, diesel, or unleaded gas.
- Battery-electric buses are designed to be compatible with one or more charging technologies, such as ground-level charging stations, inverted mast-mounted devices, or inductive charging devices.
- Trolley buses use overhead wires, also known as catenaries, for electric power supply. Dual-mode trolley buses are equipped with an ICE or a battery to enable off-wire operations.
- Fuel cell–electric buses are electric vehicles (EVs) supplied with electricity by a fuel cell–device that processes the hydrogen stored onboard.
- Hybrid-electric buses combine an ICE running on gasoline or natural gas with an electric powertrain.
Capacity and Speed
Public buses can typically carry up to 1,000 passengers per direction per hour. They are subject to road congestion and speed limits, but in urban areas, their average speed is approximately 10 mph, according to a study of the 17 largest U.S. urban bus companies (Stringer 2017). As of this writing, LSAVs can carry between 4 and 10 passengers, and they are limited to 25 mph, with cruising speeds around 10 to 15 mph (Coyner et al. 2021). While this innovative technology continues to emerge, with initial routes being actively implemented, these vehicles can transport up to 100 passengers per direction per hour as of this writing.
Stakeholder Ecosystem
A variety of stakeholders at the local, regional, state, and federal level are involved in bus transportation systems to coordinate networks that can span multiple municipalities, counties, and states. Table 10 outlines the different stakeholders that are typically involved in developing and implementing bus transportation systems.
Current Trends
Like other modes of transportation, buses are being converted to electric or hybrid electric. These buses are mostly powered by battery, but some are equipped with hydrogen fuel cells. Electric bus adoption in public transportation is growing around the world. According to BloombergNEF’s (2018) report Electric Buses in Cities—Driving Towards Cleaner Air and Lower CO2, China has been aggressive in electrifying its buses: In 2017, 99 percent of electric buses purchased that year were sold in China, which represents around 17 percent of the total Chinese bus fleet. In the United States, electric buses are also gaining popularity. By 2019, around 450 of the nearly 75,000 municipal buses on the road were electric buses. In 2021, the United States registered a 27 percent increase in electric bus deployment, up to 3,533 buses (not including trolley buses).
According to TCRP Synthesis 164: Bus Rapid Transit: Current State of Practice (Blume et al. 2022), more than 70 BRT systems were operating in the United States and Canada as of 2021. BRT has been adopted by municipalities and transit agencies on routes that warrant a mass transit system with shorter travel times than conventional buses, reduced greenhouse gas (GHG) emissions, and improved traffic safety. BRT routes are mostly on dedicated lanes separated from the rest
Table 10. Stakeholder Ecosystem for Bus Transportation
| Stakeholder | Function | Examples |
|---|---|---|
| Transit agencies and operators | Responsible for transport services and overseeing operations. | City/council/state/multistate transit authorities |
| Airport operators | Provide curbside infrastructure. | — |
| Federal regulators | Provide guidance and regulations for bus transportation. | U.S. DOT, FTA, FHWA, FAA, TSA |
| Public agencies | Provide intermodality or integration with existing transit infrastructure and network; provide regulations (local and state). | Transit authorities, state DOTs, cities, counties, metropolitan planning organizations (MPOs) |
| Industry and professional organizations | Represent the interests of and advocate for specific groups within the roadway industry. | AASHTO, American Public Works Association, American Society of Highway Engineers, Conference of Minority Transportation Officials, ITE, National Center for Mobility Management |
of the traffic. Since BRT buses have high capacity and dedicated lanes reduce traffic congestion, BRT reduces GHG emissions in cities. Finally, BRT also improves safety because its buses are not mixed with other traffic.
Similar to personal vehicles, automation is a new trend for buses and shuttles. TCRP Research Report 220: Low-Speed Automated Vehicles (LSAVs) in Public Transportation (Coyner et al. 2021) identified 73 LSAV projects in the United States that were in the planning or implementation stages in 2019. Eleven of these projects have since been completed. Such vehicles can be used to transport passengers from rental car facilities or parking garages to the terminal. While there may be an airport that launched tests with LSAVs, none have fully implemented an LSAV transportation network at this date.
Bus Rapid Transit
Definition
According to 49 U.S.C. § 5302(3), the term “BRT system” means
a bus transit system (a) in which the majority of each route operates in a separated right-of-way dedicated for public transportation use during peak periods; and (b) that includes features that emulate the services provided by rail fixed guideway public transportation systems, including (i) defined stations; (ii) traffic signal priority for public transportation vehicles; (iii) short headway bidirectional services for a substantial part of weekdays and weekend days; and (iv) any other features [that U.S. DOT] may determine are necessary to produce high-quality public transportation services that emulate the services provided by rail fixed guideway public transportation systems.
Furthermore, the FTA defines BRT as a rapid mode of transportation that provides the quality of rail transit and the flexibility of buses. It is a high-quality, bus-based transit system that delivers fast and efficient service which may include dedicated lanes, busways, traffic signal priority, off-board fare collection, elevated platforms, and enhanced stations (Federal Transit Administration 2015).
According to a WSP (2022b) study on bus transit, BRT is one of the fastest-growing public transit systems. More than 200 cities throughout the world offer BRT as part of their public transit networks. This mode of transportation offers the flexibility to combine stations, bus services, busways, and information technology (IT) into a dedicated and integrated system with light rail transit (LRT) features–for instance, passengers buy their ticket at the station to minimize boarding duration. BRT operates on dedicated lanes as far as practicable, and its vehicles mix with other traffic if a BRT corridor cannot be implemented.
Speed and Capacity
BRT vehicles reduce travel times because they have their own lane and can avoid traffic congestion. Their average speed and punctuality are typically closer to those of LRT than bus services. In São Paulo, Brazil, BRT moves between 27 and 48 km/h (between 17 and 30 mph), while standard buses have an average speed of 13 km/h (8 mph) due to street congestion (Aravena et al. 2013). Brazil has designed, built, and implemented successful BRT systems in over 13 cities. Since its first BRT system in 1974, the South American country has used BRT as one of the main modes of transportation for the public.
The capacity of BRT systems ranges from 10,000 to 30,000 passengers per hour per direction (p/h/d), according to the FTA’s (2016a) brochure on BRT. However, the implementation of the TransMilenio BRT system in Bogotá, Colombia, showed that the combination of different platforms at stations, large buses with multiple doors, express and local services, and traffic
engineering measures at intersections allows for very large passenger throughput. These measurements indicate an actual throughput of 43,000 p/h/d, with an average bus occupancy of 150 passengers per articulated bus and a commercial speed of 14 to 15 mph. According to a study carried out by the Colombian Ministry of Transport, the critical section of TransMilenio BRT, with its existing infrastructure, has a capacity from around 35,000 p/h/d and over 110 passengers per bus to 48,000 p/h/d with around 140 passengers per bus. However, changes in existing infrastructure can increase the system’s capacity, speed, reliability, and quality of service. The average bus speed is typically around 30 mph since the BRT system is operating on dedicated lanes.
Implementation in the United States
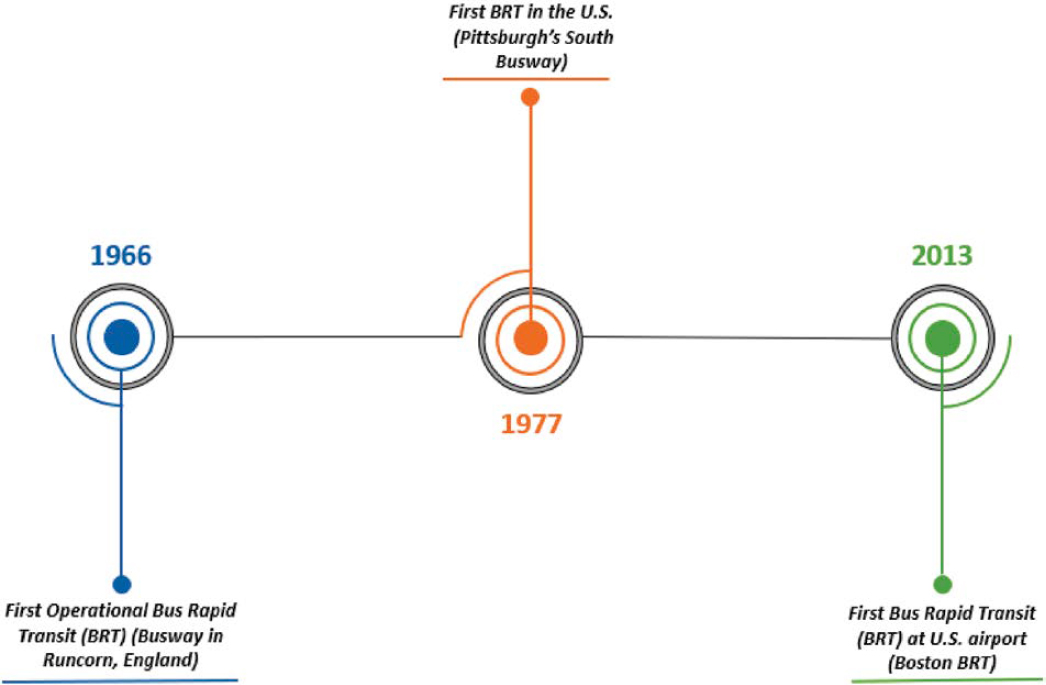
The affordability of implementation and improved level of service (LOS) compared to fixed-guideway modes have led medium and large urban areas across the United States to implement BRT systems. BRT lines complement existing public bus or fixed-guideway systems, such as with Los Angeles County Metro BRT Lines (1990) in California, the Boston BRT (2013, with access to Boston Logan International Airport [BOS]) in Massachusetts, and GoRaleigh’s BRT in Wake County, North Carolina (currently in planning stages, with opening forecasted for 2035).
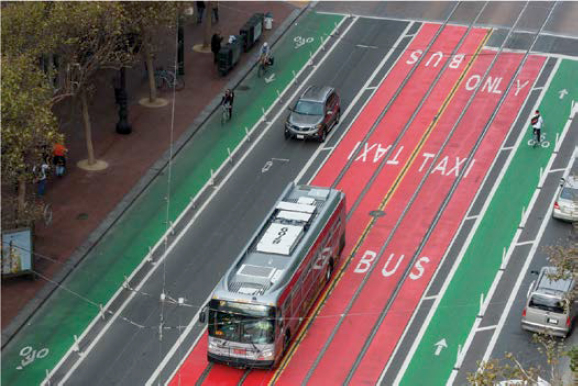
BRT right-of-way needs are different for each project: The Van Ness BRT corridor in San Francisco, California (Figure 30), carries BRT traffic on lanes dedicated to mass transit use, while other systems can use purposely built exclusive rights-of-way; the Los Angeles County G Line in California was built on a former railroad right-of-way. Hybrid combinations of BRT-like segments along bus routes are also possible in congested areas: The Van Ness BRT corridor carries two conventional bus lines through a major artery in downtown San Francisco.
Figure 31 illustrates the implementation of BRT in the United States and England.
Personal Rapid Transit
Definition
PRT is a type of automated guideway transit (AGT) consisting of small, driverless vehicles that provide on-demand, point-to-point connections. The system is made of guideways and “pods” that can carry up to eight passengers between stations; the pods select the fastest route across the guideway network without stopping on the way to the destination. PRT is considered a highly
flexible transportation option because each lightweight pod can travel directly to the desired destination, and it is more cost-effective than other mass transit systems, such as LRT.
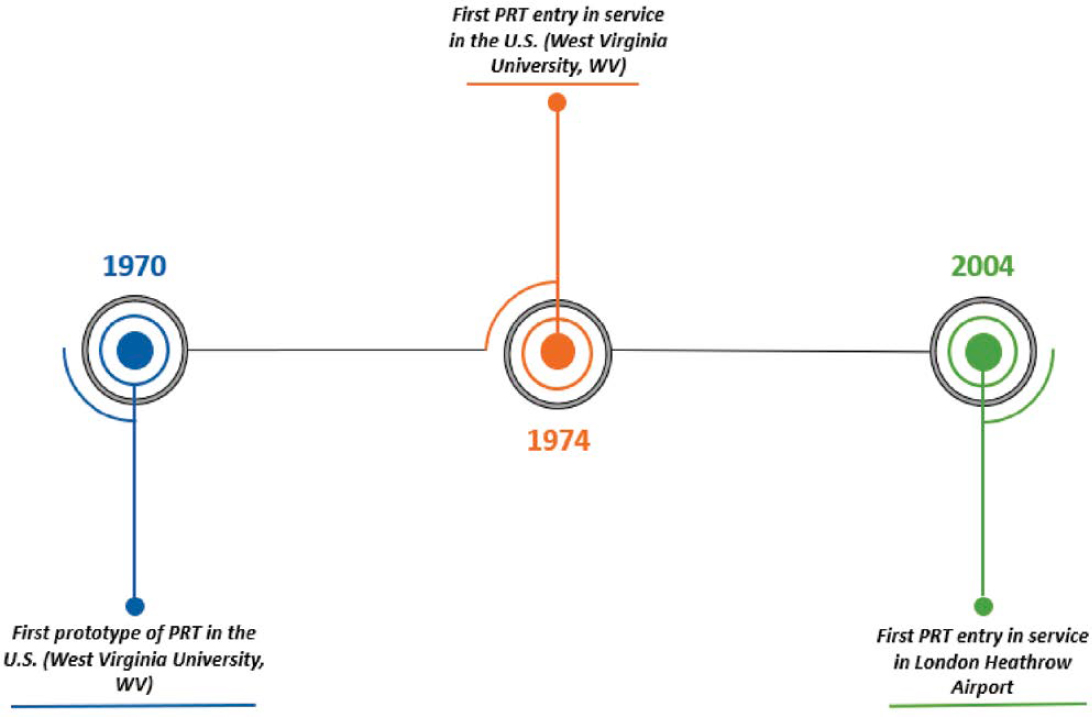
Originally a 1975 demonstration project, the PRT at West Virginia University (WVU) was the first large-scale AGT system in the United States. It consists of automated people movers (APMs) that travel on 8.7 miles of dedicated guideway, connecting three areas of the WVU Morgantown Campus and the Morgantown Central Business District. The PRT is the university’s primary mass transit system, transporting about 15,000 riders per day, including employees, visitors, and students.
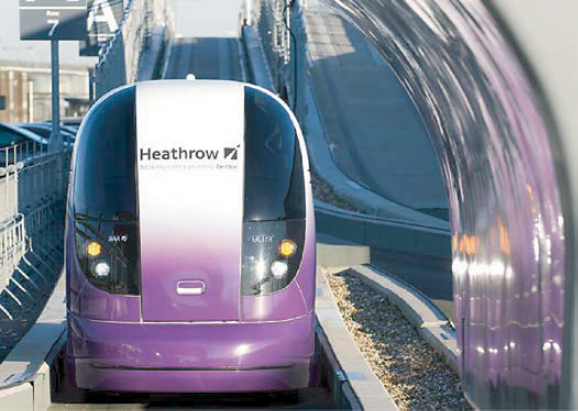
There are three examples of this type of system located at airports: London’s Heathrow Airport (LHR), as shown in Figure 32; Chengdu Tianfu International Airport (TFU) (under construction as of this writing); and Greenville-Spartanburg International Airport (GSP). At LHR, the tunnel system that provided the only access to its central terminal area (CTA) did not have capability for expansion and was over capacity. The airport authority determined that adding shuttles and taxis would not be a good idea since additional vehicles on the roads would worsen traffic. As a solution, they contracted to have a PRT system installed in 2004. When passengers park their cars at the Terminal 5 garage, they get into driverless pods that take them into the terminal area.
Capacity and Speed
The PRT system consists of electrically powered vehicles with batteries or wayside third rails that can carry up to 8 passengers per vehicle or, with group rapid transit (GRT), up to 24 passengers per vehicle. The capacity of PRT systems ranges from 2,500 to 10,000 p/h/d. Recent revisions to the ASCE standards for APMs show that PRT capacity can reach up to 20,000 p/h/d.
The travel speed of PRT is also higher than that of buses, even those in dedicated bus lanes, because PRT systems are separated from other traffic and there are no stops from the point of origin to the destination (Jones 2013). While a few PRT designs have operating speeds of 60 mph, and one as high as 150 mph is under development, most existing PRT systems are in the region of 25 to 45 mph (Rail System n.d.). Using a conservative estimate of one pod car every 3 seconds and three people per pod, a PRT system could easily transport 3,600 people per hour in each direction.
Current Trends
PRT offers many benefits to passengers, including on-demand services with short or no waiting times and travel to their preferred destination without stopping in-between. Therefore, the average speed of this system is higher than many other transportation systems.
Many of these benefits have been shown with the successful application of this system at WVU; Masdar City, United Arab Emirates; and Urban Loop in Nancy, France. At WVU, the PRT consists of 69 electrically powered vehicles that travel on 8.7 miles of guideway between five stations. According to WVU’s data, since opening in 1975, the PRT has provided over 83 million passenger trips. The PRT transports about 15,000 riders per day and serves as the university’s primary transit system for students, employees, and visitors. Figure 33 illustrates the implementation of PRT in the United States.
Stakeholder Ecosystem
When planning for a PRT system at airports, airport operators need to consult with their state DOT and FHWA if the PRT’s alignment extends beyond the airport property to serve a nearby hotel or parking facilities. If this is the case, encroachment on state DOT right-of-way would likely occur, and the state DOT and FHWA will need to authorize the use of the right-of-way.
Moreover, 23 CFR 810.200 “permits the Federal Highway Administrator to authorize a State to make available to a publicly owned mass transit authority existing highway rights-of-way for rail or other non-highway public mass transit facilities.” In addition, the “Administrator may authorize the State to make available to the publicly owned mass transit authority the land needed for the proposed facility, if it is determined that: (a) The evidence submitted by the State
highway agency . . . is satisfactory; (b) The public interest will be served thereby; and (c) The proposed action in urbanized areas is based on a continuing, comprehensive transportation planning process carried on in accordance with” the appropriate regulations, and the use of the right-of-way is to be without charge.
Heavy Rail
Definition
Heavy rail systems, also known as metro or mass rapid transit (MRT), can transport larger volumes of traffic within urban cores than LRT systems can. Unlike their lighter counterparts, heavy rail systems generally comprise multiple cars, operate on fixed rails, and use an exclusive right-of-way with no pedestrian or vehicular crossings. MRT systems also have higher acceleration and speed than LRT systems. As with some LRT stations, boarding in metro systems is done on raised platforms (American Public Transportation Association 2022a; Federal Transit Administration 2022).
Unlike other forms of rail, heavy rail is intended to transport large volumes of passengers through short distances in city centers or other high-density areas. Heavy rail systems usually do not run at-grade in dense urban areas: Systems may be elevated (e.g., Chicago “L,” Miami Metrorail) or underground (e.g., NYC Subway, DC Metro).
Deployment of heavy rail systems began in London during the 1890s. Their success led to the repurposing of existing railway lines and additional construction in New York City and Chicago
to establish their own heavy rail systems prior to the end of the 19th century. Today, heavy rail systems exist in populated metropolises across the world.
By not operating at-grade, these systems do not contribute to vehicular congestion on city streets, and their infrastructure consumes little high-valued real estate on the ground. As vehicle parking downtown tends to be expensive, transit operators have implemented park-and-ride facilities, where commuters can either park their vehicles for free or at a significantly lower rate than street parking. Alternatively, passengers can arrive at stations outside the city center by other private or on-demand means and complete their commute through heavy rail systems into downtown, according to TCRP Research Report 200: Contracting Commuter Rail Services, Volume 1: Guidebook (Cherrington et al. 2018).
Capacity and Speed
Because of their exclusive right-of-way and advanced signaling, metro systems can attain speeds above those of LRT, up to 75 mph (120 km/h). Metro systems run underground, above street level, or in a combination of both, making their construction significantly more expensive than other rail systems. Station access is located at street level, with riders taking stairs, escalators, or elevators to reach train platforms. Depending on the number of cars per train, a single metro train can carry between 600 and 2,400 passengers at a time. Unlike light rail, heavy rail is powered through an electrified third rail due to the limited space available in tunnels (Texas A&M Transportation Institute 2022).
Stakeholder Ecosystem
Urban rail systems in the United States are commonly operated by local transit agencies, which can be incorporated at the city or county level (e.g., Los Angeles and San Diego Counties in California), at the state level (e.g., Sound Transit in the Seattle, Washington, metropolitan area), or as a multistate entity (e.g., Washington Metropolitan Area Transit Authority’s [WMATA’s] board includes representatives from the District of Columbia, Maryland, and Virginia).
The FTA and state DOTs provide regulation for overall development of transit systems, while work affecting U.S. highways (including interstates) or state routes requires coordination with or approval from FHWA or state DOTs. Just as municipalities and counties are concerned with land management and acquisition within their jurisdictions, airport authorities likewise concern themselves with projects within airport property. They focus on how to integrate projects with airport facilities (terminals, multimodality hubs, etc.) and address the specific needs of passenger and employee services, including considerations for frequency and security.
Light Rail Transit
Definition
The FTA describes LRT as a railway system designed for a lower traffic demand than heavy rail (i.e., metro and commuter rail). Light rail is typically powered through an overhead electric line and may operate an exclusive or semi-exclusive right-of-way at street level (Federal Transit Administration 2022; Cornell Law School n.d.). The term “light rail” does not refer to the vehicles’ physical weight but rather to their capacity in comparison with heavy rail.
LRT tends to be part of wider transportation systems that may also include heavy rail, conventional buses, or BRT. An example of this multimodality is the Los Angeles Metro, which not only operates heavy rail, LRT, and BRT but also permits transfers that are limited, time-based,
and free between the three systems. The average unlinked trip distance on LRT systems in 2018 was 5.2 miles, slightly longer than that of metro systems (Federal Transit Administration 2019).
Given public demand for more flexible transportation options, LRT has been adopted as a solution in high-income cities around the world. According to a study on LRT technology by WSP (2022d), LRT systems have experienced a significant resurgence in recent times. Cities are looking for more flexibility to meet the travel demands of their people.
Many of these benefits have been realized in existing systems worldwide, such as the Line in Vancouver, Canada; Porto Metro in Porto, Portugal; and Sydney Light Rail in Sydney, Australia. Within the United States, light rail systems have been realized in Boston Light Rail, Massachusetts; Muni Metro Light Rail in San Francisco, California; Sacramento Light Rail, California; Transit Express in Salt Lake City, Utah; San Diego Trolley System, California; Metropolitan Area Express light rail in Portland, Oregon; and Link Light Rail in Seattle, Washington. Moreover, some of these systems have connections to airports, such as Denver Airport Rail to Denver International Airport (DEN), METRO Blue Line to Minneapolis-St. Paul International Airport (MSP), and LYNX Silver Line to Charlotte Douglas International Airport (CLT).
Capacity and Speed
LRT systems operate at around 30 mph (48 km/h), which is slightly higher than the speed limits within U.S. city centers. Their operating capacity is a fraction of that of heavy rail alternatives at around 10,000 to 12,000 passengers per direction per hour; these operations take place at street level, and these vehicles may be either step-entry or accessed by level boarding (i.e., through slightly elevated platforms to allow for roller bags) (Cornell Law School n.d.). For example, LRT lines in Boston, Massachusetts, and San Francisco, California, carry 9,600 and 13,100 passengers per hour, respectively, in the peak direction during rush hour. Both LRT and heavy rail are powered by electricity, but LRT generally uses overhead cables as the delivery mechanism. LRT does not necessarily have an exclusive right-of-way; road vehicle and pedestrian crossings may be controlled by stoplight systems or moving barriers (i.e., crossing gates).
Commuter and Regional Rail
Definition
Commuter rail systems are a scheduled, short-distance local transit option between urbanized areas, their bedroom communities, and other nearby urbanized areas (typical distance of 20–30 miles). Tickets are generally sold for multiple trips at a time (either as a fixed number of trips or for a set amount of time) with fares that vary by distance, and there are significantly longer distances between stops than in LRT systems. Intercity rail providers can also be contracted by public transportation agencies to offer commuter rail service within a limited range (American Public Transportation Association 2022a). Commuter rail systems might operate on the same tracks with intercity or freight rail, with operators paying the track owners for its use (U.S. Government Accountability Office 2021). Both commuter and intercity rail are included in states’ rail plans (Federal Railroad Administration 2013).
Capacity and Speed
Commuter rail systems can be easier to deploy in metropolitan areas that have (or had) rail services since their tracks and rights-of-way might already be in place. Like intercity rail, commuter rail operates at street level with a semi-exclusive right-of-way, with moving barriers and aural alerts used to prevent pedestrians and other vehicles from accessing the tracks when
a train passes. Intercity train stations can be used for commuter rail (e.g., Pennsylvania Station in New York City and Union Station in Washington, DC), but commuter rail stations built for that purpose also exist. Trainsets are larger and have more capacity than those of heavy rail, with some that are dual-deck (such as the Maryland Area Regional Commuter [MARC] rolling stock between Maryland and Washington); however, their passenger throughput (30,000 passengers per direction per hour) is less than heavy rail due to lower operating speeds and reduced service frequency.
Current Trends
Rail systems, especially heavy rail, had been experiencing a general upward trend in ridership between 1990 and 2019, as noted in Figure 34. Restrictions caused by the COVID-19 lock-downs and stay-at-home orders caused the number of transit trips taken in the United States to plummet.
However, this short-term trend should not be considered irreversible, as public transit will become increasingly necessary in the context of increasing urbanization in the United States. TCRP Research Report 231: Recent Decline in Public Transportation Ridership: Analysis, Causes, and Responses proposed several avenues that transit operators can follow to address this. Increases in service frequency have led to rail ridership growing between 10 and 18 percent as additional capacity and flexibility is offered to travelers. A case example on giving crossing priority to LRT (and other higher-capacity systems) in Minneapolis/St. Paul—prioritizing the movement of LRT at intersections—has also led to improvements in ridership. In addition, fare increases have been correlated with decreases in ridership; thus, fare policies need to be reimagined to adapt to a post-COVID-19 world (Watkins et al. 2022).
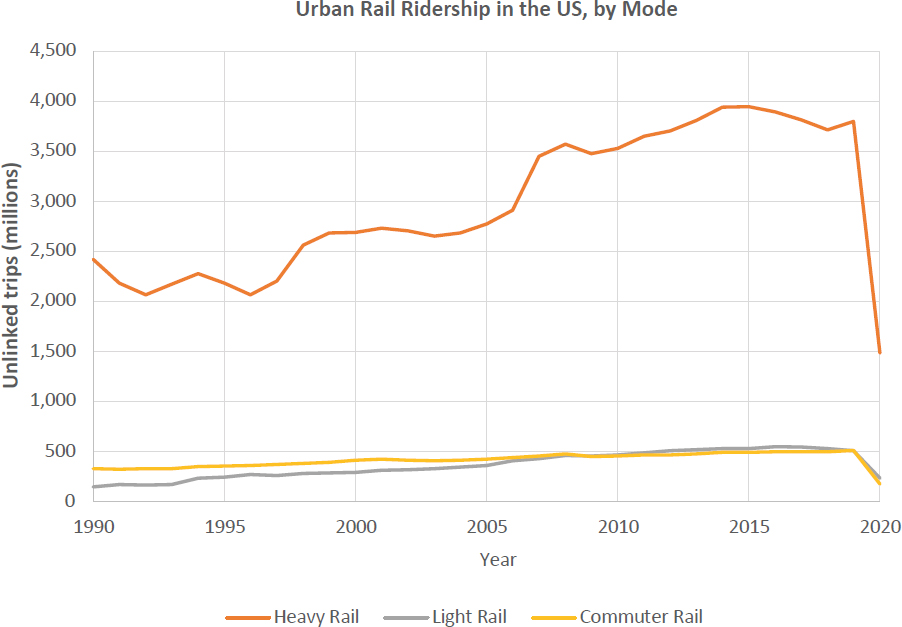
Source: American Public Transportation Association (2022b)
Intercity and High-Speed Rail
Definition
Intercity rail is defined in 49 U.S.C. § 24102 as rail passenger transportation, which includes long-distance routes except for commuter rail passenger transportation. Intercity passenger rail “primarily refers to Amtrak’s intercity passenger services that connect one city to another,” which can include high-speed rail (American Association of Railroads 2023).
Multiple definitions have been used by the U.S. government and the industry to define high-speed rail. Prior to the creation of the High-Speed Intercity Passenger Rail (HSIPR) Grant Program, the Federal Railroad Administration had a market-driven definition of high-speed rail (Peterman 2016): a service “that is time-competitive with air and/or auto for travel markets in the approximate range of 100 to 500 miles” (Federal Railroad Administration 1997). However, statutory definitions of high-speed rail are speed-based. As summarized by the Congressional Research Service (CRS) in the report The Development of High Speed Rail in the United States: Issues and Recent Events (Peterman et al. 2013), various statutes with differing definitions have resulted in three separate speed-based definitions of high-speed rail. Table 11 provides a summary of these three different definitions.
After the creation of the HSIPR program, the Federal Railroad Administration used the standard found in the U.S. CFR under 49 U.S.C. § 26106(b)(4), which is service “reasonably expected to reach 110 mph (175 km/h).” To add further to the various definitions of high-speed rail, in 2009 High-Speed Rail Strategic Plan (Federal Railroad Administration 2009a), the agency identifies three speed-based corridors of high-speed rail, with speeds ranging from 110 mph on shared track to up to 150 mph on grade-separated track to over 150 mph on completely grade-separated, dedicated rights-of-way. To clarify the various definitions of high-speed rail, CRS created two definitions to encapsulate high-speed rail:
- Higher-speed rail: high-speed rail on shared tracks with speeds up to 150 mph (240 km/h).
- Very high-speed rail: high-speed rail on dedicated tracks with speeds over 150 mph (240 km/h).
Capacity and Speed
The capacity and speed of intercity and high-speed rail varies depending on the train cars being used. To be considered high-speed rail, based on the definitions provided earlier in this section, a train needs to reach speeds of at least 90 mph (145 km/h). Table 12 provides a summary of different carrying capacities and speeds for operators in the United States.
Table 11. Speed-Based Statutory Definitions of High-Speed Rail in the United States
| Statute | Year Enacted | Speed Component of Definition |
|---|---|---|
| High-Speed Rail Assistance | 1994 | 49 U.S.C. §26105: “Reasonably expected to reach sustained speeds of more than 125 miles per hour” |
| High-Speed Rail Corridor Development Program | 2008 | 49 U.S.C. §26106(b)(4): “Reasonably expected to reach speeds of at least 110 miles per hour” |
| Railway-Highway Crossing Hazard Elimination in High-Speed Rail Corridors Program | 1991 | 23 U.S.C. §104(d)(2)I: “Where railroad speeds of 90 miles or more per hour are occurring or can reasonably be expected to occur in the future” |
Source: Peterman et al. (2013)
Table 12. Train Capacity and Speed for Planned and Operating Intercity and High-Speed Passenger Rail in the United States
| Operator | Corridor | Airport Station | Rolling Stock Fuel | Cars per Train | Capacity of Persons per Train Car | Capacity of Full Length (passengers) | Highest Speed | Sustained Speed | Frequency of Service (daily round trips) |
|---|---|---|---|---|---|---|---|---|---|
| California High-Speed Rail (under construction) | Shared and dedicated corridors: San Francisco/Sacramento-Merced-Los Angeles-San Diego | New Underground Burbank Airport Station | TBD | 8–16 | TBD | 726–1,634 | 220 mph (354 km/h) | TBD | TBD |
| Amtrak Pacific Surfliner | Los Angeles-San Diego-San Luis Obispo (LOSSAN Rail Corridor) | Burbank Airport Station (0.25-mile walk) | Diesel locomotive | 6 | 70–96 | 485 | 90 mph (140 km/h) | 41 mph (66 km/h) | 9 round trips |
| Amtrak Acela | Northeast Corridor | BWI Thurgood Marshall Airport (via shuttle bus) | NA | 6 | 44–65 | 304 | 150 mph (241 km/h) | 68 mph (109 km/h) | 10 round trips |
| Brightline Florida | Dedicated right-of-way owned by Florida East Coast Railway between Miami and West Palm Beach; service from Miami to Orlando beginning in late 2023 | Orlando International Airport Station (Orlando Station) | Diesel-electric trainsets | 4 | 54–74 | 248 | 79 mph (127 km/h) to 125 mph (201 km/h) (planned) | Varies | 17 round trips (M–F); 10 round trips on Saturday; 9 round trips on Sunday |
| Brightline West | Dedicated right-of-way between Las Vegas, NV, and Victor Valley, CA; connections to Metrolink and planned future connection to California High-Speed Rail in Palmdale | NA | Electric trainsets | TBD | TBD | TBD | 180 mph | Varies | TBD |
Source: Siemens (2016, 2021); Railway Gazette International (2016); Amtrak (2018); Brightline (2023)
Note: NA = not applicable; TBD = to be determined.
From Intercity to High-Speed Rail Service
Until very recently, intercity rail transport in the United States was operated under a monopoly by Amtrak, a for-profit company operated by the U.S. government. After the Federal-Aid Highway Act of 1956—which spurred the creation of the interstate highway system and an increase in car-based intercity transport—and the Transportation Act of 1958, which allowed rail operators to discontinue passenger service in favor of more profitable freight service, intercity passenger-rail figures precipitously decreased in the following decade. Amtrak was created in response to ensure that this essential public service would be retained, according to a study published by Puentes et al. (2013).
Even though the deregulated airline market now competes directly with Amtrak on some short-haul routes, it remains a significant player in the Northeast, Pacific, and Chicago markets—incidentally, these are the same markets where legacy commuter rail lines serve. Train ridership in these areas is outpacing population growth, according to Puentes et al. As an example, the Northeast Corridor—which links Boston, New York City, and Washington, DC, and stops at both Baltimore/Washington International Thurgood Marshall Airport (BWI) and Newark Liberty International Airport (EWR)—is the most-traveled corridor in the United States. The Northeast Corridor posted a ridership of 11.7 million passengers in fiscal year 2015—a 22 percent increase since fiscal year 2005—and major infrastructure upgrade plans, such as the Gateway Program between Newark, New Jersey, and New York City, have been executed to improve safety, reliability, and passenger experience along this line, per a fact sheet by the Federal Railroad Administration (2016).
Private high-speed rail projects have identified other parts of the United States where this mode would provide a profitable service while also competing with personal vehicles, intercity buses, and short-haul air travel. The high-speed rail line Brightline—which connects Miami, Fort Lauderdale, and West Palm Beach, Florida, without intermediary stops—has been expanded to Orlando International Airport’s (MCO’s) intermodal station. This expansion connects two major tourism centers in Florida with a travel time from door to door that could become comparable to air transport. Ultimately, Brightline is planning to extend the line to Tampa. Likewise, the planned California High-Speed Rail (CAHSR) underground train station at Hollywood Burbank Airport’s (BUR’s) new terminal building will connect San Francisco to San Diego. Another high-speed passenger train line underway is the Texas High-Speed Train, which is planned to connect North Texas and Greater Houston in under 90 minutes (Texas Central 2021).
Stakeholder Ecosystem
Similar to the airport environment, intercity and high-speed rail involve various stakeholders at the local, regional, state, and federal levels due to the long routes that both modes need to traverse. Connecting cities together requires coordination with a variety of different agencies and organizations, including the cities themselves and communities served. Furthermore, the stakeholder ecosystem can differ depending on whether a public authority (e.g., for CAHSR) or a private entity (e.g., Brightline) is leading the project. Brightline, a private-entity operator, currently has one operating high-speed rail line in Florida, and another high-speed rail project is in the planning stages and intended to travel between Southern California and Las Vegas, Nevada.
Generally, stakeholders for an intercity or high-speed rail project include
- Federal Railroad Administration,
- FHWA,
- State transportation agencies,
- State DOTs,
- Bureau of Land Management,
- Surface Transportation Board (STB),
- Railroads and utilities,
- Local and regional agencies or organizations,
- City governments,
- City transportation agencies,
- Neighborhood associations, and
- Other transit operators (e.g., bus, airport).
Collaboration between agencies assists with the establishment of certifications and permits (e.g., local regulations, STB) and acquisition of land for rights-of-way, substations, railroad crossings, and the like. City and county stakeholders include not only places where a station is planned but also communities where a rail corridor is proposed for through-travel between destinations.
Current Trends
In November 2009, the Regional Plan Association (RPA) published a paper on U.S. megaregions (Hagler 2009), regions of anticipated growth that would lead metropolitan areas to expand and fuse together, blurring political boundaries and interlocking major population centers. Megaregions are a concept that can be used to identify these demographic and economic trends beyond political boundaries, promote coordinated and mutually beneficial policies (i.e., intercity travel), and foster the protection of natural resources. Eleven megaregions were identified in the RPA report, as shown in Figure 35.
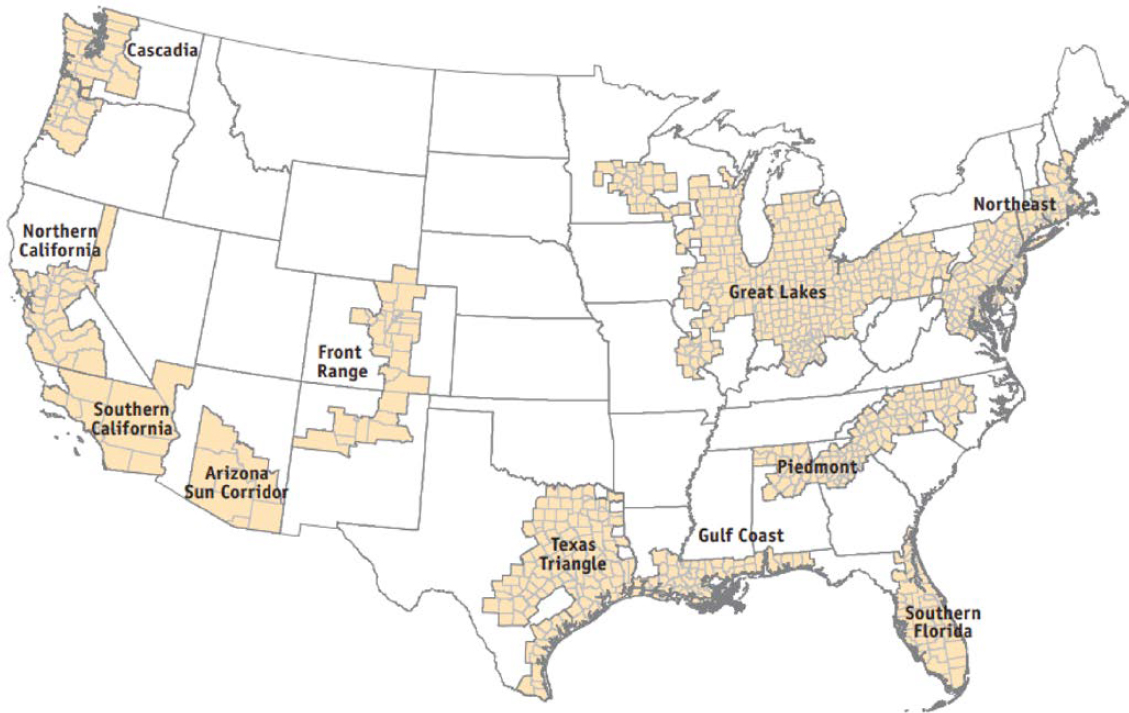
Source: Hagler (2009)
The megaregions outlined by RPA reflect where high-speed rail and intercity rail are currently experiencing the most attention. Within the Southern Florida megaregion is the Brightline high-speed rail, with an extension to MCO. Amtrak’s Acela high-speed rail train resides in the Northeast megaregion.
Three other projects—CAHSR, Texas Central, and Brightline West—are proposed within megaregions identified by RPA. CAHSR is a state-led effort, while Brightline (both Florida and West) and Texas Central are led by private entities:
- CAHSR: The CAHSR project resides in the Northern and Southern California megaregions identified by RPA. CAHSR was approved by California voters in 2008 under Proposition 1A. Since then, it has gone through planning and environmental review, and some sections are currently in final design phases while others are under construction. The line is intended to connect to BUR, and it has undergone scope changes due to community feedback. The environmental documents for the section connecting to the airport were approved by the Airport Authority Board in January 2022. The high-speed rail station to BUR will be located underground and adjacent to the new airport terminal, with access to the Metrolink stations for commuter rail and bus service connections at the airport.
- Texas Central: The Texas Central project, in the early planning stages, aims to connect Dallas to Houston via high-speed rail. The preferred corridor, along a utility corridor for minimized environmental impact, was selected by the Federal Railroad Administration in August 2015. The alignments alternatives analysis report in November 2015 identified potential alignment locations (Texas Central High-Speed Railway 2015). Public hearings on the draft Environmental Impact Statement (EIS) were held in March 2018. In September 2020, the Federal Railroad Administration issued final safety standards for the Texas Central high-speed rail system. Construction is set to begin in the near future, with testing and commissioning starting in 2025 and commercial service opening in 2026 (Texas Central High-Speed Railway 2015).
-
Brightline West: There is less information available for Brightline West, a high-speed passenger-rail system with a planned connection between Las Vegas and Southern California. As of their July 2022 project update, the remaining timeline is as follows:
- – Second half of 2022: Complete acquisition of right-of-way and permits.
- – October 2022: Receive intercity passenger rail grant.
- – November 2022: Federal Railroad Administration completion of environmental review and permitting.
- – Second half of 2023: Break ground.
- – Approximately 3.5 years for construction.
- – 2027: Open for revenue service. Brightline West aims to be in operation for the Los Angeles 2028 Olympics to provide an alternative mode of transportation for Olympics attendees (Brightline West 2022).
Air-Rail Competition and Interlining
Analysis from other countries in Europe and Asia—where widely available high-speed rail competes with 40 percent of domestic air transport routes—suggests that some passengers prefer high-speed rail. This leads to fewer seats being offered in air transport routes, according to Mineta Transportation Institute’s MTI Report 12-35: Modal Shift and High-Speed Rail: A Review of the Current Literature (Haas 2014). As a condition for state aid during the COVID-19 pandemic and as part of their emissions-reduction programs, the French and German governments required their flag carriers—Air France and Lufthansa, respectively—to discontinue short flights that could be covered by high-speed rail. In response, air carriers in Europe have partnered with their local railway operators to sell intermodal tickets for medium- and long-haul travel.
For example, a traveler from Brussels, Belgium, can take a train to Amsterdam Airport Schiphol (AMS) and then travel with KLM Royal Dutch Airlines to New York, all under a single ticket.
These partnerships are not limited to legacy flag carriers. Ultra-low-cost carriers, such as easyJet, have also found interlining with national railway companies to be an effective approach. The seamless integration between airlines and high-speed rail operators through interlining, which places the burden on operators in case of delays or missed connections, shows how high-speed rail and airports can coexist. Nevertheless, much work remains for these strategies to be implemented in the United States.
Maglev
Definition
Maglev trains—unlike their wheeled, conventional rail counterparts—have superconducting magnets on both train cars and guideways that create magnetic fields used to levitate, accelerate, and decelerate trains along the guideways. Since these trains move above the ground, they neither encounter the same sources of friction nor have the same steering limitations as conventional trains, delivering higher cruising speeds and improved energy efficiency.
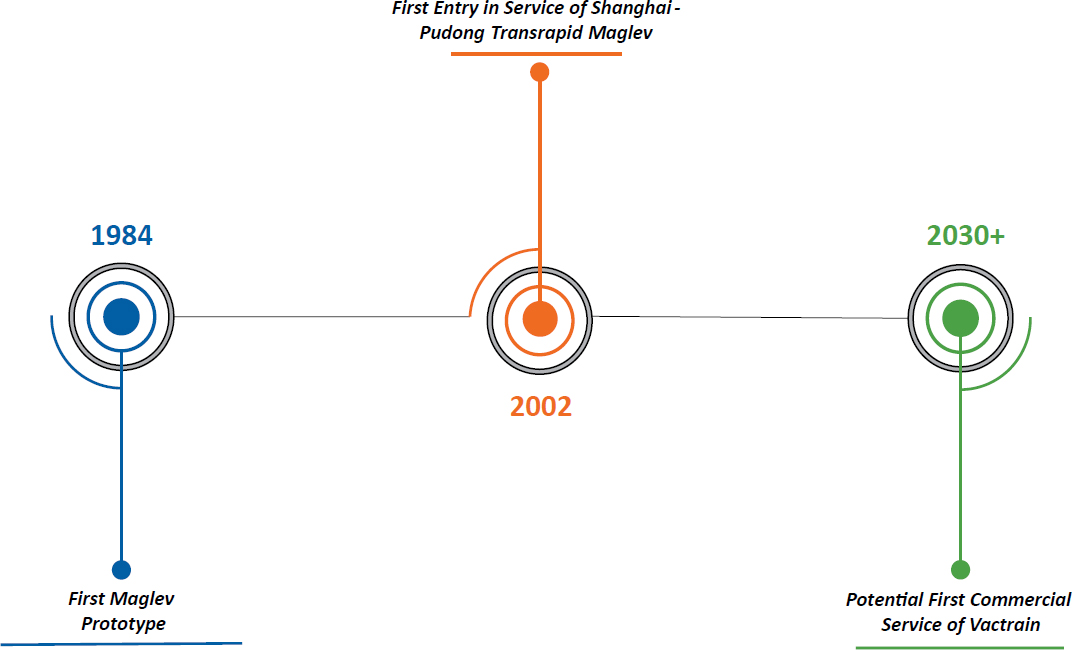
To minimize the drag generation of operating at high speed, maglev trains can operate within evacuated (i.e., vacuum-like) and sealed tubes or tunnels, significantly increasing their operating speed with high efficiency. Combining these “vacuum” guideways with maglev technology was first conceptualized in 1904 as the “vactrain.” Since then, the hyperloop—a type of vactrain proposed in the early 2010s—has become synonymous with vactrains overall.
In Pathways to the Future of Transportation: A Non-Traditional and Emerging Transportation Technology (NETT) Council Guidance Document, U.S. DOT (2020b) defines a hyperloop as a pod and magnetic levitation–based mode of transportation in a vacuum-sealed tube or system of tubes that operates in a low-pressure environment to reduce drag, increasing efficiency to reduce travel times.
Capacity and Speed
Open-air maglev train systems can transport a similar number of passengers per train car as conventional trainsets but can travel with a top speed of 375 mph, with drag and passenger comfort limiting further increases (U.S. Department of Energy 2016). Since a large share of a maglev train’s energy consumption at high speed is used only to overcome drag, all but one (i.e., Shanghai Transrapid in China) of the three maglev systems in operation as of 2023 are low speed, with maximum operating speeds of up to 100 mph and a design capacity of 100 passengers per car (Gurol et al. 2002).
As maglev technology has developed and more firms have entered the field, pod design capacities have evolved from 28-passenger pods (Tesla 2013) to a range of passenger capacities between 20 and 80 people per pod. The speed of hyperloop technology also varies, but on average, the maximum operational speed proposed by hyperloop developers is stated to be between 620 to 750 mph (1,000 to 1,200 km/h). However, early hyperloop systems are not expected to be tested and certified at these speeds for commercial operation, and there is no time frame established for when these speeds could be tested (AECOM 2020).
Stakeholder Ecosystem
Maglev and hyperloop encompass a vast variety of stakeholders in research and development that are aiming to advance the system. Stakeholders include industry professionals and span
from manufacturers to regulators to universities. Emerging companies and firms are looking to produce and bring this technology into the transportation market. In the United States, companies such as Virgin Hyperloop, Arrivo, and Hyperloop Transportation Technologies (HyperloopTT) have begun development of hyperloop technologies. Both public and private sectors are involved in the process of research and development, and both can be expected to stay involved as the technology matures, regulations are drafted, and public communications are put forward.
Table 13 offers a broad look at the stakeholder ecosystem, identifying stakeholders and their potential roles by mapping out the potential future functions and types of stakeholders that could be part of hyperloop systems. The table has three columns: stakeholder, function, and examples. The examples provide potential candidates that may fill the stakeholder role. The table is not an exhaustive list but rather preliminary mapping of potential stakeholders for hyperloop systems.
Current Trends
Maglev technology is currently available at two large airports: the Shanghai Transrapid at Shanghai Pudong International Airport (PVG) in China and the Incheon Airport Maglev near Seoul, South Korea. Within the United States, a project to connect Washington, DC; BWI; and Baltimore through high-speed maglev service is under environmental review, with plans to ultimately extend it to New York City (Congressional Research Service 2021).
Table 13. Stakeholders and Their Function
| Stakeholder | Function | Examples |
|---|---|---|
| Vehicle manufacturers | Firms that develop or manufacture maglevs or vactrains as well as parts and accessories. | Transrapid (Germany); Virgin Hyperloop (United States); Arrivo (United States); HyperloopTT (United States) |
| Operators | Responsible for providing transport services and overseeing operations. | Transit authorities; private corporations or companies (Virgin Hyperloop, Arrivo) |
| Federal regulators | Provide guidance and regulations for hyperloop technologies. | U.S. DOT; Federal Rail Administration |
| Public agencies | Intermodality or integration with existing transit infrastructure and network; regulation at local and state levels. Potential funding organization to implement hyperloop systems and integrate into the transit network. | Transit authorities; state DOTs; cities; counties |
| Infrastructure | Design, construct, and maintain the facilities and infrastructure necessary for hyperloop technologies. | The Boring Company (United States); utility companies |
| Professional organizations | Organizations that represent the interests of specific groups with a focus on hyperloop technologies. Conduct research and development on hyperloop technologies and components of the hyperloop system. | IEEE |
| Finance | Financing transportation projects, including new technologies. | Colorado Transportation Investment Office |
| Users | Patronize hyperloop systems. | Passengers; freight handlers |
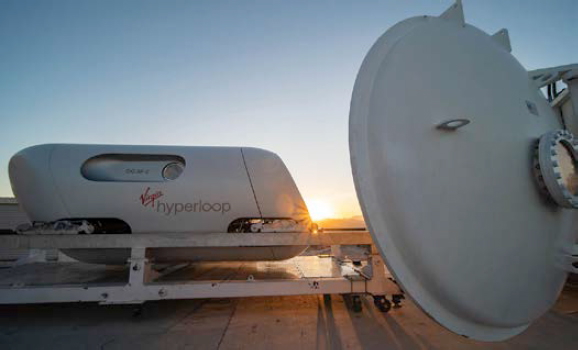
Vactrain, and more particularly hyperloop, designs are being developed by several companies, such as Virgin Hyperloop, HyperloopTT, and TransPod. Figure 36 depicts one of these concepts from Virgin Hyperloop. To date, there are only concepts and prototypes for vactrains, of which one has been tested on a test track in Las Vegas. If vactrain systems are implemented, the entire infrastructure and operating model will need to be constructed from scratch.
In the United States, vactrain developers have proposed using their technology to create new transportation systems in several regions. Many of these proposals include connections to commercial service airports. Arrivo, a Los Angeles–based startup, announced their intention to open a line between Aurora, Colorado, and DEN. HyperloopTT expressed similar plans for connecting downtown Chicago and other cities of the Great Lakes and Midwest to the Chicago O’Hare International Airport (ORD). However, none of these projects has materialized so far.
The regulatory framework for vactrain is at the same stage as advanced air mobility (AAM). In January 2021, U.S. DOT published the report Hyperloop Standards Desk Review (Non-Traditional and Emerging Transportation Technology Council 2021) to “assess the status of hyperloop standardization activities, to develop a foundation for future hyperloop standardization efforts and to identify stakeholder perspectives on the applicability of existing standards to domestic testing and deployment.” TransPod, a Toronto-based startup, announced plans to work with Transport Canada to establish a regulatory framework in Canada and to certify their first lines between 2020 and 2025. Currently, the year of vactrain commercialization remains uncertain. Manufacturers, such as Virgin Hyperloop and HyperloopTT, estimate that the first commercial vactrain in the United States will be operational by 2030. Figure 37 provides a potential timeline of vactrain implementation.
Aerial Cableway Technology
Definition
Aerial cableway transportation is a type of transportation system that carries passengers and goods in cable cars (i.e., vehicles suspended from a continuously moving cable). The most common types of cable cars are aerial tramway, funitel, ski lift, chairlift, gondola lift, and zip line. A cableway system can move 2,400 passengers per direction per hour; thus, it has a greater capacity than a three-car LRT system running at 15-minute intervals, which can carry an estimated 1,800 passengers in the same time frame. The entire structure can operate using a single electric
500-horsepower motor. The range of aerial cableways is inherently limited, a factor that should be considered when evaluating their suitability for specific travel needs.
According to a WSP study on aerial cableway technology (Wahl and Schumacher 2018), this system offers multiple benefits, including lower costs compared to other modes, the ability to overcome major changes in topography and other obstacles in natural and artificial environments, the ability to divert from congested roads while moving many passengers, and the potential to integrate transit-oriented development near aerial cableway platform stations.
Capacity and Speed
Urban aerial cableway systems use one of three system technologies: aerial tramway, monocable detachable gondola (MDG), or tri-cable detachable gondola (3S). The capacity and speed of these three systems vary, as seen in Table 14.
Stakeholder Ecosystem
Aerial cableway systems are fairly limited as a form of urban transit, mostly due to their range limitation; however, like most forms of transit, the stakeholder ecosystem involves a variety of stakeholders performing in different roles and capacities. Table 15 highlights key types of stakeholders for aerial cableways, their function, and examples.
Current Trends
In 2016, Miami-Dade MPO published a feasibility study on implementing an aerial cableway system as a form of urban transit (Jacobs et al. 2016). Within the feasibility study, several
Table 14. Key Characteristics of Aerial Cableway Technologies
| Aerial Tramway | Monocable Detachable Gondola | Tri-Cable Detachable Gondola | |
|---|---|---|---|
| Description | Aerial tram systems usually include one or two cabins fixed to the same cable loop that oscillates back and forth. | The most used type of aerial cableway technology, the MDG utilizes one cable to both support and move cabins through the system. The cabins are typically fixed to this cable. | The 3S is faster, has a higher per-cabin capacity, and can operate in higher wind speeds than the MDG. It is also one of the most expensive types of aerial cableways. |
| System Capacity (p/d/h) | 2,000 | 4,000 | 6,000+ |
| Cabin Capacity | 250 | 15 | 38 |
| Maximum Operating Speed | 45 km/h (~28 mph) | 25 km/h (~16 mph) | 30 km/h (~19 mph) |
| Access Speed (for boarding and alighting) | N/A | 60 feet per minute | 60 feet per minute |
| Maximum Wind Speed During Operation | 80 km/h (~50 mph) | 70 km/h (~43 mph) | 100 km/h (~62 mph) |
Source: Doppelmayr (2023)
Note: p/d/h = passengers per direction per hour; N/A = not available.
preliminary alignments were considered as potential aerial cableway transit corridors. Many of these alignments were discarded from further study due to the local area’s preference for LRT, the cost or alignment length, or local distaste for visual disruption obstructions such as cables and towers.
Due to the minimal integration of aerial cableways into urban transit systems in the United States, there are few federal regulations regarding the technology. The FTA does not regulate aerial cableways unless an operator receives funding through the FTA to assist with implementation
Table 15. Stakeholder Ecosystem and Stakeholder Function for Aerial Cableways
| Stakeholder | Function | Examples |
|---|---|---|
| Manufacturers and repairers | Firms that develop, manufacture, or repair the vessels, parts, and accessories. | Leitner-Poma; Doppelmayr Group |
| Operators | Responsible for transport services and overseeing operations. | Private operator; public-private partnership; public/local transit operator |
| Airport operators | Provide station infrastructure at airport terminus. | N/A |
| Federal regulators | Provide guidance and regulations for aerial cableway technologies. | State departments; cities; FAA; FTAa |
| Public agencies | Intermodality or integration with existing transit infrastructure and network; regulation at the local and state levels. | Transit authorities; state departments; cities; counties |
| Infrastructure | Design, construct, and maintain the facilities and infrastructure necessary for aerial cableway technologies. | Utility companies; private companies (e.g., Leitner-Poma) |
| Finance | Develop means to generate finances for aerial cableway technologies. | Insurers, financers (i.e., private, local, state, federal) |
| Users | Patronize the mode of transportation. | Passengers (tourist and commuter) |
Note: N/A = not available.
a Only when funding is received through the FTA—subject to the National Environmental Policy Act (NEPA)
costs; in such cases, the FTA requires oversight of the environmental review prior to system construction. Regulations and regulators primarily come from the state level, and they extend all the way down to the local level. Regulations can include state energy regulations, labor protections and codes, and environmental protections, as well as applicable city regulations and certification requirements. Federal regulations do apply when implementing aerial cableway systems near airports, as airspace needs to be considered. Communication with the FAA can assist in meeting the necessary safety requirements for flying aircraft and an aerial cableway system. Furthermore, the American National Standards Institute (ANSI) has national standards in the form of ANSI B77.1 Aerial Tramways Safety Standard, last updated in 2022. This document provides specific standards for aerial cableways, including design (height, approach path, load points, stations, electrical, etc.), operation, evacuation, and personnel training.
Urban Air Mobility
Advanced air mobility (AAM)—including urban air mobility (UAM) and regional air mobility (RAM)—is the broad concept of a safe and efficient aviation transportation system that can transport passengers or cargo within and between urban and suburban areas as well as smaller communities. AAM would use various aerial vehicles, most of which feature a fully electric or hybrid-electric propulsion system powered by batteries or hydrogen fuel cells. Also, most of these aircraft have vertical takeoff and landing (VTOL) or short takeoff and landing (STOL) capabilities.
UAM would provide on-demand intra-urban connections and operate from new vertiport facilities or existing heliports that would be adapted to accommodate these new aircraft. UAM operations feature characteristics of both air taxis and transportation network companies (TNCs). The technical and operational feasibility of UAM has been demonstrated in a few large metropolitan areas. For instance, São Paulo, Brazil, was accommodating over 400,000 conventional helicopter operations before the COVID-19 pandemic. Electric vertical takeoff and landing (eVTOL) aircraft might feature lower operating costs than helicopters, making on-demand vertical flight more affordable for point-to-point urban mobility. UAM might be implemented at many more large cities over the coming decades using eVTOLs or electric/hybrid-electric aircraft that are significantly quieter, greener, and potentially cheaper to operate than conventional VTOLs (i.e., helicopters) and STOLs.
RAM will provide connections to smaller airports or isolated communities through both on-demand and scheduled flights. The current operations of air carriers such as Cape Air in the Northeast and Harbor Air in the Puget Sound (Seattle–Vancouver area) have RAM-like features. Cape Air operates from small facilities, such as Nantucket Memorial Airport (ACK), and large-hub airports (e.g., Boston and St. Louis).
Certain airports, communities, and states are already preparing their facilities to accommodate AAM services to diversify their accessibility and provide faster connections to their catchment area. To preserve capacity and increase efficiency, some airports might elect to develop new, separate facilities for accommodating these services. Vertiports can be located outside of the main air operating area, such as the former heliport at Los Angeles International Airport (LAX) on the rooftop of parking garage P-4.
As of this writing, there are no specific regulations or policies regarding AAM, except a first draft of FAA’s Engineering Brief No. 105, Vertiport Design (EB No. 105), published in March 2022. ACRP Research Report 236: Preparing Your Airport for Electric Aircraft and Hydrogen Technologies (Le Bris et al. 2022) and ACRP Research Report 243 (Mallela et al. 2023) explore electric aircraft accommodation holistically and provide practice-ready guidelines to airport practitioners.
The Advanced Air Mobility Coordination and Leadership Act was passed by the House of Representatives (H.R.1339, 117th Congress) in November 2021 and the Senate (S.516, 117th Congress) in March 2022. A working group under the leadership of U.S. DOT to “plan for and coordinate efforts related to the physical and digital security, safety, infrastructure, and Federal investment necessary for maturation of the AAM ecosystem in the United States” will be created under these bills. All the different stakeholders of the industry will be represented, including aviation stakeholders, electric utilities, energy providers, market operators, and representatives of the major federal agencies (e.g., FAA and NASA).
In the early 2010s, eVTOL aircraft gained momentum, leading to the emergence of pioneering prototypes. Since 2020, eVTOL manufacturers have reaped roughly $12 billion in investments. Companies like Beta, Jaunt, Joby, and Wisk in the United States; Eve in Brazil; and Lilium and Volocopter in Germany are working toward certification of an astonishing array of aircraft, with the first certifications expected between 2023 and 2026. Manufacturers of eVTOL aircraft are now targeting 2028 or later for the first commercial flight.
Waterway Transportation
Definition
Waterway transportation groups together several modes of transportation that are used to navigate bodies of water: rivers, seas, oceans, lakes, canals, etc. It can offer either on-demand services with short or no waiting times (i.e., water taxi or shuttle) or scheduled public transportation (i.e., ferries) to passengers. For this report, three modes of transportation are considered waterway transportation:
- Water taxis or shuttles are small motorboats functioning as taxis. Those offer on-demand services between two locations across short distances (i.e., under 30 miles).
- Ferries are boats that carry passengers; they offer schedule services with multiple stops and operate similarly to a bus.
- Ground-effect vehicles (GEVs), also known as wing-in-ground-effect vehicles, are aerial vehicles that fly just a few feet above the water. These innovative vehicles, currently in the preoperational phase, are scheduled to undergo flight trials in 2024, with plans for commercialization in 2025.
Currently, two U.S. airports have water transportation services: BOS and Ketchikan International Airport (KTN) in Ketchikan, Alaska. BOS has a water taxi service operated by Boston Water Taxi. This service, available on demand, spans 25 locations along the Boston waterfront. The boat dock, located southeast of the airport, is seamlessly connected to the terminal through a complimentary airport shuttle service. Meanwhile, KTN on Gravina Island relies on ferry access from the city. A connecting canopy ensures passenger comfort while ferries disembark on Gravina Island by linking the docking area to the passenger terminal. In addition, LaGuardia Airport (LGA) is exploring the possibility of introducing a ferry service to establish a connection between the airport and Manhattan. Shuttle bus connections would be implemented at both landings to facilitate the seamless transportation of passengers to and from airport terminals.
Capacity and Speed
Capacity and speed vary depending on the type of vehicle and transportation mode. The technical report 2018 Census of California Water Transit Services (Kos et al. 2019) provides orders of magnitude of capacity and speed for each waterway transportation mode:
- Water taxi or shuttle: Typically, water taxis have a seating capacity of up to 50 passengers. The usual cruising speed of these boats is up to approximately 20 knots (23 mph).
- Ferry: Ferry seat capacity typically is between 100 and 1,000 seats. The typical cruising speed of ferries is up to approximately 20 knots (23 mph).
- GEVs: GEVs are expected to have a typical capacity between 10 and 50 seats, like water taxis. However, they will be designed with cruising speeds of up to 160 knots (180 mph).
Stakeholder Ecosystem
Waterway transportation involves a wide range of stakeholders with different purposes and objectives. According to the article America’s Marine Highway Stakeholders: A System-Scale Analysis of Influence in Decision Making (Mokashi et al. 2020), a waterway transportation system involves stakeholders that span from vessel manufacturers to transportation providers (port and vessel operators) to regulators to industry suppliers to environmental advocates to users, in the context of waterway transportation as an airport ground access technology.
Table 16 outlines the different stakeholders that will be involved by the development and implementation of waterway transportation at airports.
Current Trends
The advent of new technologies, especially through electrification, will create new opportunities for water transportation at certain coastal airports. Several startups are working on electric, on-demand water taxis, such as SeaBubbles (first prototype in 2017, shown in Figure 38) or Candela (first delivery in 2022). The type of services offered will be similar to UAM and could be remotely controlled. For longer connections, a new category of vessels has emerged in recent years: high-speed electric flying boats. REGENT, a Boston-based startup, has been developing an electric, flying ferry GEV to transport passengers between coastal cities, with a range of up to 500 miles, as shown in Figure 39. In August 2022 during its first flight test, this model achieved its first series of flights.
Although the first prototypes of these new technologies might come out within the next five years, there are no existing regulations regarding these technologies as modes of public transportation. While electric on-demand water taxi operation will be regulated and certified by the
Table 16. Stakeholder Ecosystem for Waterway Transportation
| Stakeholder | Function | Examples |
|---|---|---|
| Vessel manufacturers and repairers | Firms that develop, manufacture, or repair the vessels, parts, or accessories. | REGENT (U.S.); SeaBubbles (France); Candela (Canada) |
| Transportation operators | Responsible for transport services and overseeing operations. | Transit authorities; private water taxi or ferry providers |
| Airport operators | Provide docking infrastructure. | BOS, LGA |
| Federal regulators | Provide guidance and regulations for waterway transportation. | U.S. DOT; U.S. Maritime Administration; U.S. Coast Guard; U.S. Army Corps of Engineers |
| Public agencies | Intermodality or integration with existing transit infrastructure and network; regulation at local and state levels. | Transit authorities; state DOT; cities; counties; MPOs |
| Fuel/utility suppliers | Cooperate with implementation of fuel service or electric charging stations, if necessary. | Airport; fuel providers; utility providers |
| Financial stakeholders | Developing means to generate finances for waterway transportation. | Insurers; financers |
| Environmental advocates | Advocate protection of the environment and conservation of resources. | Environmental nongovernmental organizations; media |
| Users | Waterway transportation passengers. | Passengers |
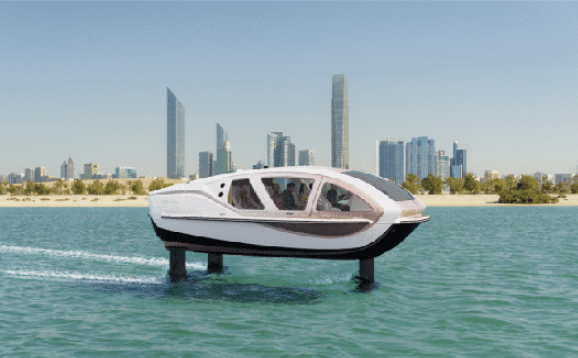
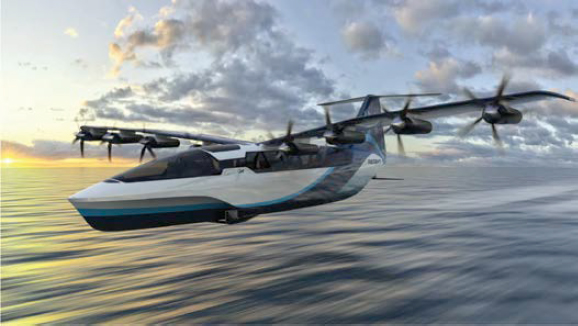
maritime authorities, this process is more ambiguous and complex for high-speed flying boats. REGENT expects to be regulated and certified by maritime authorities because their vessel operates over water and below normal airspace, and it will not use airports. However, their craft is not entirely a boat nor an aircraft, and the FAA could require adherence to specific aeronautical regulations, especially concerning flight plans, pilot trainings, and pilot logs.
Summary
Based on the research findings presented in this chapter, Figures 40 and 41 provide a summary of the typical travel speed and corridor capacity, respectively, for each mode of transportation identified. Lastly, Table 17 presents a comprehensive overview of the major characteristics identified in this chapter for all ground access modes.
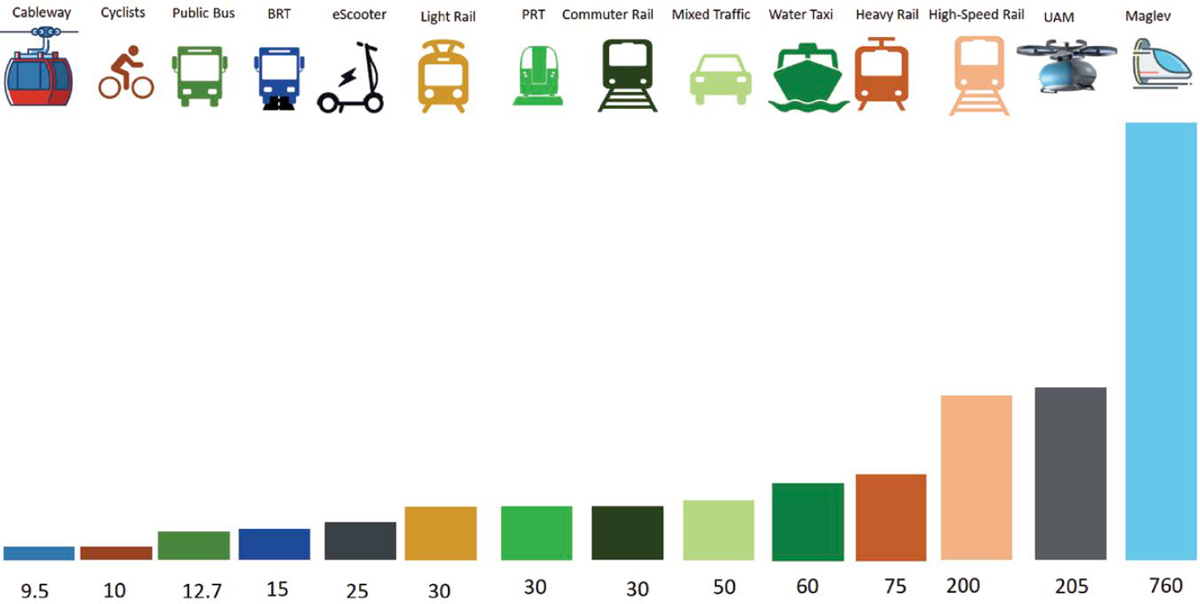
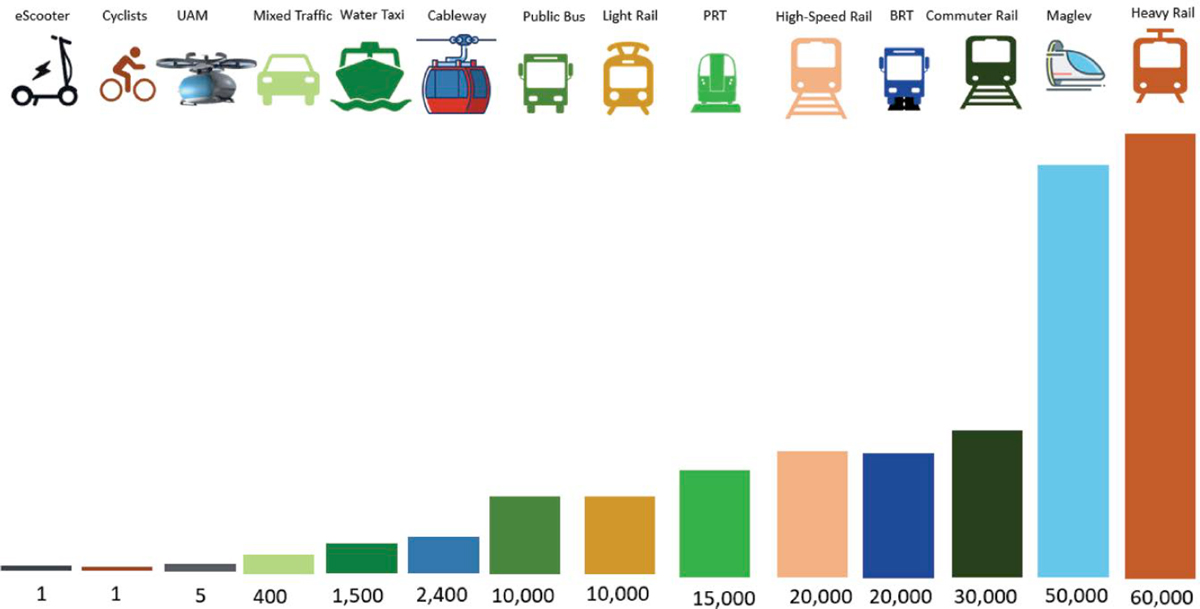
Table 17. Comparison of Various Access Modes and Technologies
| Mode or Technology | Airport Examples | Non-Aviation Examples | Capacity (p/d/h) | Typical Speed | Typical Cost per Mile (construction) | Availability | Main Implementation Challenges | Key Benefits |
|---|---|---|---|---|---|---|---|---|
| Micromobility (e-scooters) | DCA; LAS; PHL | Most cities | Variable | Variable | Variable | Yes | Safety concerns | Environmentally friendly |
| Moving walkways (mode connecting) | NA | Santander and Vitoria, Spain | Up to 7,500 pax/hour | 6 to 10 mph | Variable | Yes | Public acceptance; city architecture | Reduce road congestion |
| Connected and automated vehicles | NA | Waymo; Tesla; Apple | 1,500–2,000 | <75 mph | Variable | 2025+ | ADS technology; cybersecurity; regulation | Automation; driverless (some); point-to-point, on-demand transportation |
| Bus rapid transit | LAX FlyAway Bus; IndyGo, SEA (King County Metro, Sound Transit); Nicolls Road BRT | Montgomery County, MD, DOT—Flash (under construction); LA County Metro BRT Lines (J, G); Boston BRT (pilot); Suffolk County, NY (under construction); Pittsburgh, PA | 20,000–35,000 | 14–15 mph | $10.24 million | Yes | Creating guideway system | Lower the air pollution concentration citywide while reducing passenger travel times because of the decrease in traffic congestion |
| Public bus | BOS; CMH; PIT; DEN; MSP; DUB | San Diego MTS Bus system; Pittsburgh, PA; Madison, WI; Denver, CO; Chicago, IL—Chicago Transit Authority | 10,000 | 14 mph | $2.64 million | Yes | Traffic congestion | Low cost; flexible |
| Personal rapid transit | LHR | Masdar, United Arab Emirates; West Virginia University | 15,000 | 30 mph | $10–15 million | Yes | Creating guideway system | Moderate cost; automated, point-to-point, on-demand transportation |
| Heavy rail | DCA; PHL | New York Subway, WMATA | >60,000 | 75 mph | $600–800 million (underground) | Yes | Construction costs; complex infrastructure | Road congestion reduction with exclusive right-of-way; fast transport within urban cores |
| Light rail | SEA; LCY | DART (Dallas) | 10,000–12,000 | 30 mph | $150–250 million | Yes | Creating a guideway system | Convenient, accessible, and sustainable alternative; provides intermodal connectivity |
| Mode or Technology | Airport Examples | Non-Aviation Examples | Capacity (p/d/h) | Typical Speed | Typical Cost per Mile (construction) | Availability | Main Implementation Challenges | Key Benefits |
|---|---|---|---|---|---|---|---|---|
| Commuter rail | BWI; EWR | Long Island Rail Road | 30,000 | 30+ mph | $50 million (upgrade from freight lines) | Yes | Land use and right-of-way issues | Highway congestion reduction; no right-of-way issues with major roads; reduced emissions per capita vs. private vehicles |
| Intercity/high-speed rail | MCO | Amtrak; Japan Railways | 20,000 | Up to 200 mph (Japan Railways bullet train) | $80 million | Yes | Land use and right-of-way issues | Less travel time than airplane trip on short routes; reduced emissions per passenger-mile |
| Maglev trains/vactrain/hyperloop | NA | Shanghai maglev train; Virgin Hyperloop | Up to 50,000 | 760 mph | $54 million | 2025+ | Creating infrastructures and network | Less travel time than airplane; less noise than airplane |
| Aerial cableway technology | LPB | Shanghai Bund Sightseeing Tunnel; Mexico City Iztapalapa Cable Car; Disney Skyliner; Santo Domingo Cable Car | 2,400 | 9.5 mph | $50–60 million | Yes | Creating a guideway system | Overcome major changes in topography; minimal footprint; avoids congested roadways |
| Urban air mobility | NA | São Paulo, Brazil | Up to 5 pax per aircraft | 150–205 mph | Variable | 2022–2025 | Creating urban vertiports; regulations; passenger cost | High-speed, greener, and quieter point-to-point mobility |
| Water transportation | BOS; LGA; KTN; VCE | Fort Lauderdale, FL; San Francisco, CA; Seattle, WA | Up to 400 pax | <60 mph | Variable | Yes | Creating ports at airports and connecting to terminals | Less ground traffic congestion |
Note: ADS = automated driving systems; CMH = John Glenn Columbus International Airport; DART = Dallas Area Rapid Transit; DCA = Ronald Reagan Washington National Airport; DUB = Dublin Airport; GRU = São Paulo/Guarulhos International Airport; LAS = Harry Reid International Airport; LCY = London City Airport; LPB = El Alto International Airport; MTS = Metropolitan Transit System; NA = not applicable; pax = passengers; p/d/h = passengers per direction per hour; PHL = Philadelphia International Airport; PIT = Pittsburgh International Airport; SEA = Seattle-Tacoma International Airport; VCE = Venice Marco Polo Airport.


