Enhancing Airport Access with Emerging Mobility (2025)
Chapter: Appendix B: Mobility Solutions at Non-aviation Facilities
APPENDIX B
Mobility Solutions at Non-aviation Facilities
Purpose
This appendix provides a selection of case studies of ground access and internal mobility solutions for public accommodation at large non-aviation facilities. This review of other industry examples, applicable or relevant to airports, includes non-aviation transportation facilities (e.g., ports, train stations), resorts, campuses, industrial parks, and urban mobility applications. For each case study, the historical and transportation contexts are analyzed, and the multimodal and intermodal aspects of ground access as well as the interactions and potential synergies between these modes and technologies are analyzed.
Ground Access at Selected Train Stations
Context
Train stations, like airports and ports, are gateways to cities; but unlike ports and airports, train stations serve both commuting passengers as well as intercity travelers. As passengers traveling by train will likely not have access to their own motor vehicles during at least one end of their journey, train stations must provide multimodal access to their users to be effective.
Pennsylvania Station (“Penn Station”), New York City
One valuable example of this is Pennsylvania Station in Manhattan, New York City, which is the busiest station in the Western Hemisphere with over 600,000 weekday travelers in 2019 (Kimmelman 2019). Penn Station serves as the sole Amtrak station in New York City, with passengers arriving from various cities in the United States—especially from within Amtrak’s Northeast Corridor high-speed rail service—as well as Canada. Additionally, commuters from Long Island and New Jersey reach the city at Penn Station through the Long Island Rail Road and NJ Transit systems, respectively (commuter rail services to Upstate New York and beyond depart from Grand Central Terminal). In 2017, over 42 percent of all commuters into Manhattan from outside New York City used trains as their main means of transport, of which 162,000 arrived from Long Island and Inner New Jersey, both arriving at Penn Station, while in-city commuters overwhelmingly use subways to reach their workplaces (New York City Planning 2019).
Passengers within the city can access Penn Station via Eighth Avenue (Lines A, C, and E) and Seventh Avenue (Lines 1, 2, and 3) NYC Subway lines at station level, Metropolitan Transportation Authority’s (MTA’s) bus services, TNCs and taxis, and micromobility aboveground (Figure 104). The various modes of travel to Penn Station that a traveler takes depend on the traveler’s distance and willingness to pay. Due to the congested nature of New York City’s streets
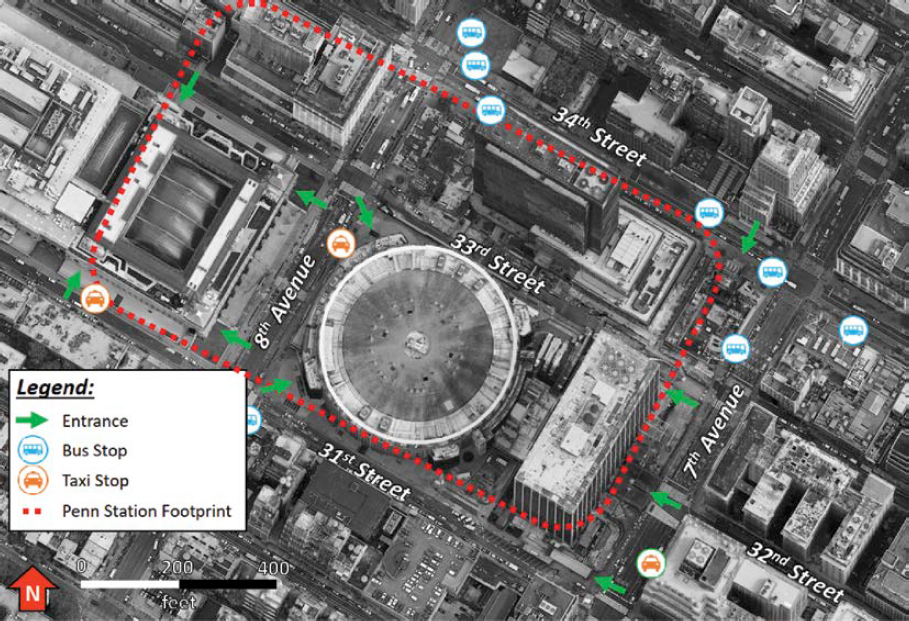
Note: Penn Station is an underground station.
and the extensive vertical development in Manhattan, private car access may be outright impossible or too expensive for many.
Brightline Stations, Florida
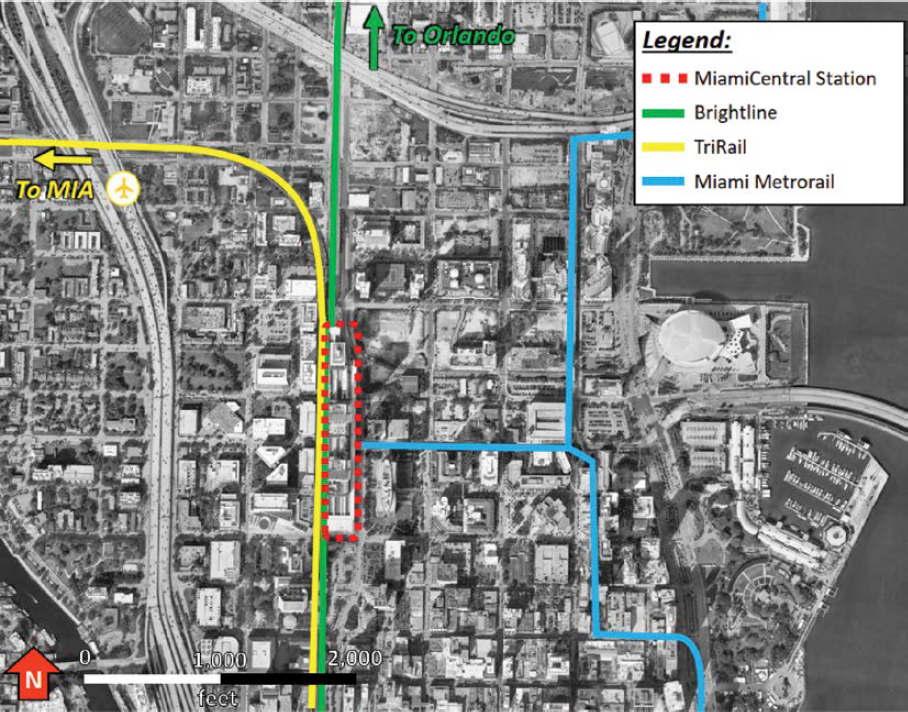
The fact that air transport is the predominant form of long-distance travel in the United States does not mean that new high-speed rail projects are at a standstill—indeed, these can even synergize well with air transport. The Brightline project in Florida is one of the first high-speed rail projects that, upon reaching its full extent, provides transport times comparable to those of air travel between its two major cities, Miami and Orlando, while also offering a fast transport alternative between Miami, Fort Lauderdale, and Palm Beach. The Orlando terminus, located at the new South Terminal at Orlando International Airport, is part of a large multimodal development between air transport, high-speed rail, TNCs, and hotel/theme park shuttles. The Miami terminus, MiamiCentral Station, provides further connectivity with the Miami International Airport (MIA) via an automated people mover, commuter rail services (Tri-Rail), and mass rapid transit (Miami Metrorail) (Figure 105). Brightline also offers shuttle and other on-demand rides from the Miami terminus.
Ground Access at Port of Miami
Port of Miami, located in Miami, Florida, has 11 cruise terminals to serve passengers and cruise lines alike. Ground access to the port is available through the following methods:
- Taxi
- Rideshare
- Rental Car
- Shuttle/Limo service
- Public Transit (connection by ground transportation)
- Metrorail
- Miami Trolley
- Tri-Rail
- Brightline intercity train (connection by ground transportation)
Most cruise lines offer shuttle services for passengers arriving from MIA. Additionally, private shuttle/limo services can be booked for passengers not traveling from MIA. Taxis are available for a flat rate coming from MIA to the Port or vice versa, and an accruing rate for all other destinations to or from the Port. Similar to taxis, rideshare services like Uber and Lyft are available transportation options. For passengers utilizing a rental car, parking garages are available at the Port and its surroundings, which are pay-to-park and charged per day.
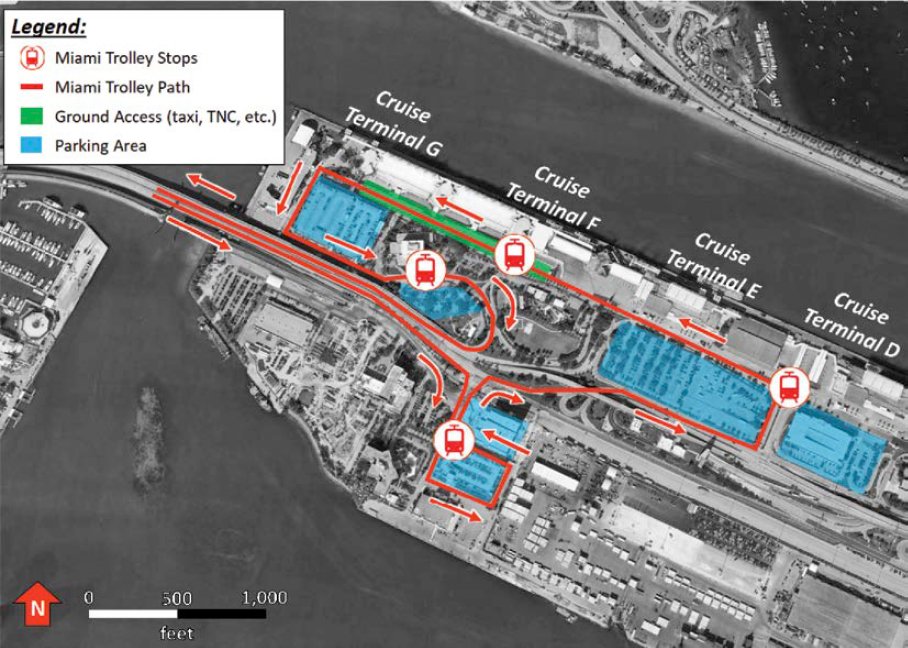
Brightline MiamiCentral Station comes close to the Port; however, passengers cannot directly access the Port of Miami through Brightline. MiamiCentral Station is approximately 1.7 miles from the Port of Miami, which means passengers require additional transportation to arrive at the Port of Miami. Brightline offers a transportation option for passengers traveling from elsewhere in Florida, as it has a station in Orlando, West Palm Beach, Fort Lauderdale, and Miami. Miami Metrorail’s Orange Line has a station located approximately 1.5 miles from the Port of Miami and can connect passengers coming from elsewhere in Miami or passengers traveling from MIA. An additional transportation option is required to complete the journey to the Port of Miami from the Orange Line station. The City of Miami also has a trolley system with stations located on-Port and stops every 15 to 20 minutes Monday through Saturday from 6:30 a.m. to 8 p.m. The Coral Way route on the Miami Trolley has four stops on-Port (Figure 106).
For passengers traveling from Fort Lauderdale/Hollywood International Airport (FLL), rideshare and taxis are available as well as the Tri-Rail commuter train. Tri-Rail offers shuttle buses from FLL to the Tri-Rail station, which can then be used to connect to Miami Metrorail Orange Line at MIA.
Personal Rapid Transit at West Virginia University
Context
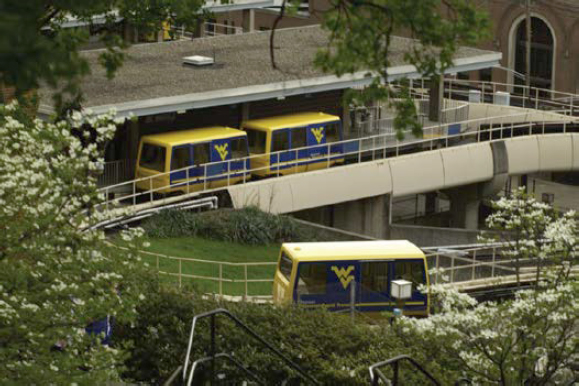
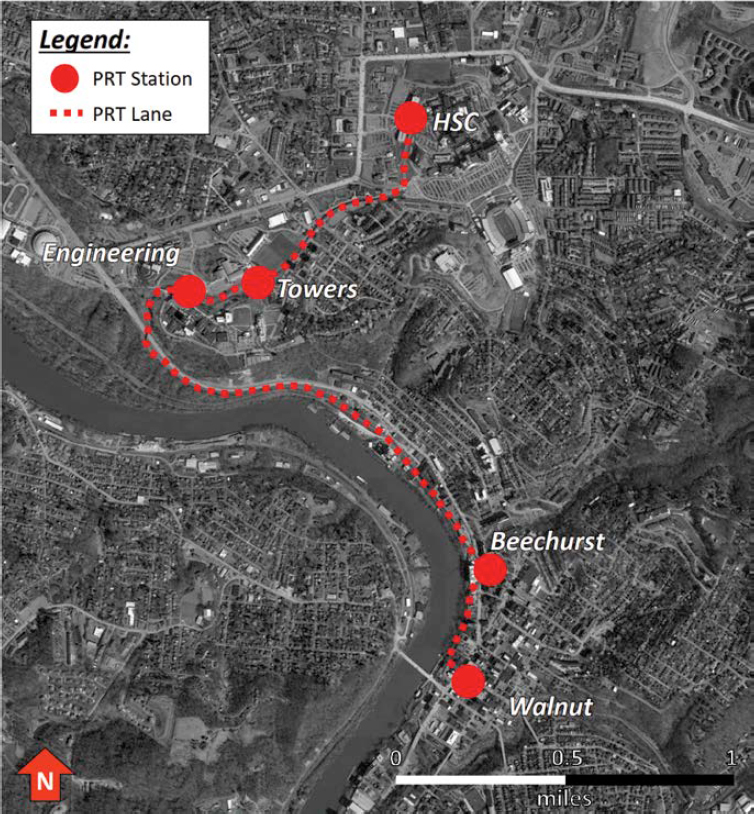
West Virginia University (WVU) was first to implement a large-scale automated guideway transit system in the United States (Figure 107). WVU’s personal rapid transit (PRT) is an automated mover that connects three main areas of the WVU campus and the Morgantown central business district. According to an article published by the university, this system was designed and developed in the early 1970s by Boeing. It consists of a fleet of 69 electronically powered, rubber-tired vehicles that travel on 8.7 miles of dedicated guideway between five stations (Figure 108).
According to the university’s study on the success of the PRT since its opening in 1975, it has provided over 83 million passenger trips and taken many cars off Morgantown’s busy streets (West Virginia University 2021). The PRT carries about 15,000 riders daily and serves as the university’s primary mass transit system for students, employees, and visitors.
Sustainability
The all-electric system keeps many cars off the road and helps reduce carbon dioxide (CO2) emissions across the university’s campus. According to a cost-benefit study done by the
Source: West Virginia University (2021)
university’s research repository, it reduces carbon emissions by close to 2,200 tons each year (West Virginia University 2021). It would take 34 autobuses to replace this system on an average day and 40 buses running on a 2.5-minute loop to accomplish the same level of service that the pods provide when there are special events at the university, like football games. The carbon emission savings that this system has are equivalent to removing over 350 cars from the road and powering more than 150 homes.
The PRT has 69 cars or pods, which can accommodate 8 passengers while seated and carry a total of about 15 passengers. The system can travel up to 30 miles per hour. And it takes only 11.5 minutes to ride the entire length of the system. The pods are powered by electric motors that are environmentally friendly.
Ground Mobility at Ski Resorts: Park City, Utah, and Breckenridge, Colorado
Park City, Utah
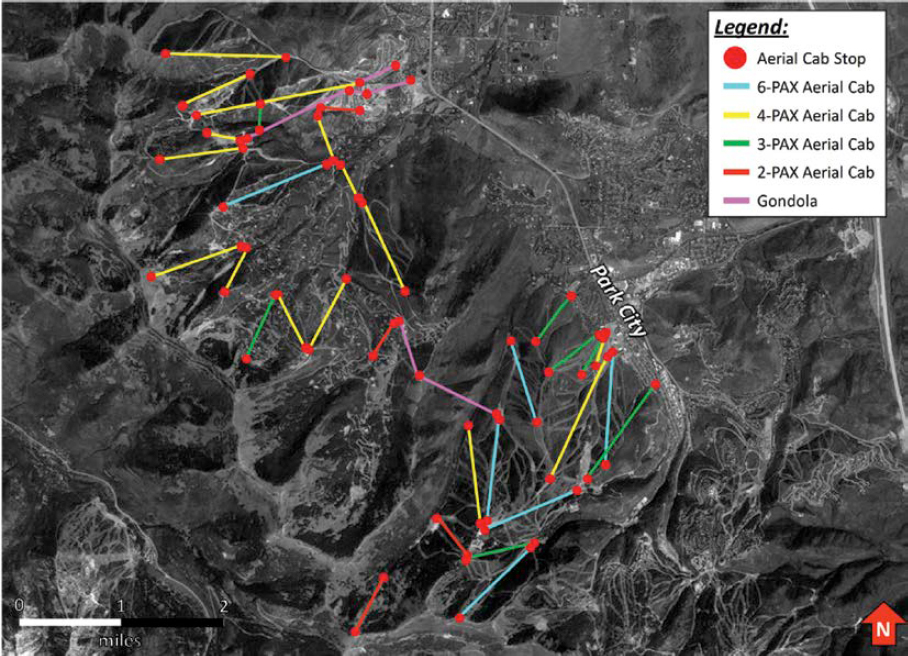
Within Park City, Utah, are numerous aerial cableways to access the ski routes in winter as well as hiking trails and adventure activities in summer (Figures 109 and 110). The Town Lift in Park City, Utah, is one aerial cableway that transports people from lower Main Street to the bottom of the Bonanza Lift for Park City Mountain Resort skiing. The Town Lift takes about 10 minutes to ride the full length and connects to other chairlift routes at the end of its line. Park City Mountain Resort and Canyons Resort offer a network of gondolas and chairlifts to connect ski routes across the two mountain peaks. The chairlifts vary in capacity from two to six passengers on each lift. The gondolas fit eight passengers in enclosed cabins. The Cabriolet can also be accessed from the town of Park City, and its base is found north of the Town Lift.
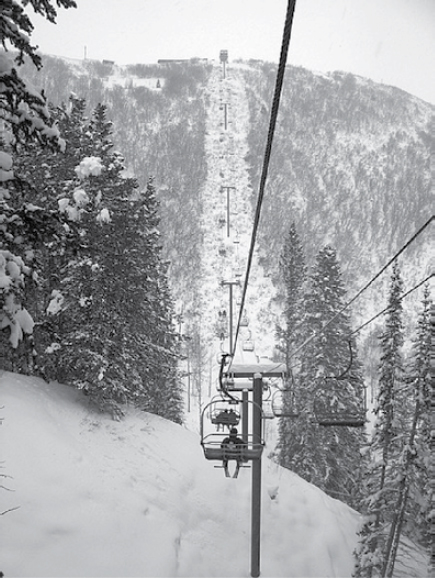
Source: Photo by Chris Pimlott, 2005
Breckenridge, Colorado
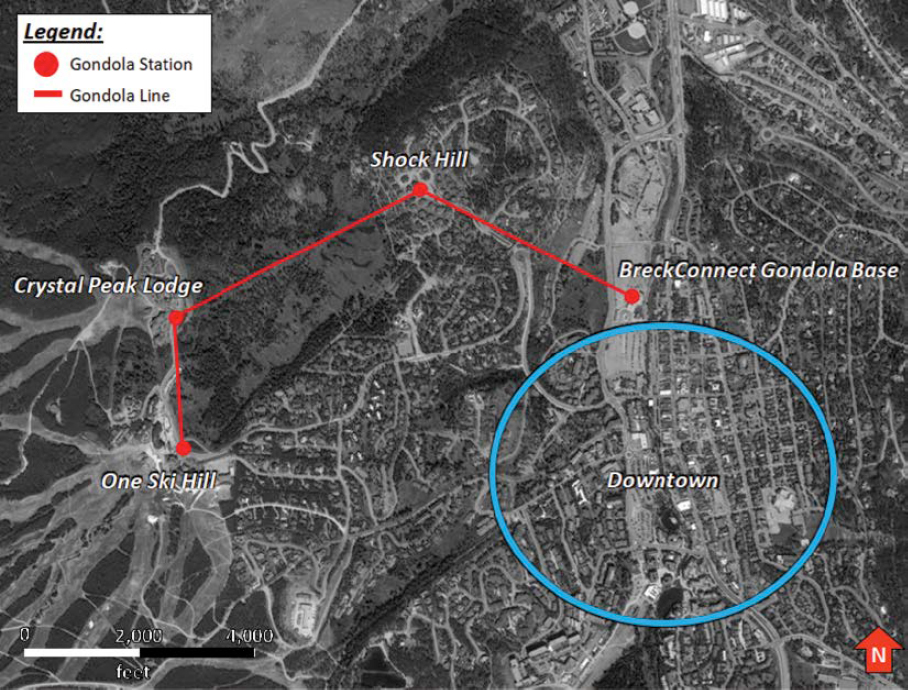
Similarly, the BreckConnect gondola connects Breckenridge, Colorado, with ski areas (Figure 111). The gondola service starts in downtown Breckenridge and is free to ride to visitors and residents alike. The gondola can carry up to eight passengers and has three stops along the way: Shock Hill, Base of Peak 7–Crystal Peak Lodge, and Base of Peak 8–One Ski Hill Place. The gondola service does not run year-round; it closes from end of April to mid-June, then reopens for the summer season, followed by another short closure starting after Labor Day until the start of ski season. The gondola covers almost 400 feet in vertical rise and 7,600 feet in travel length, and it takes about 13 minutes to ride.
Waterways as Transportation Infrastructure
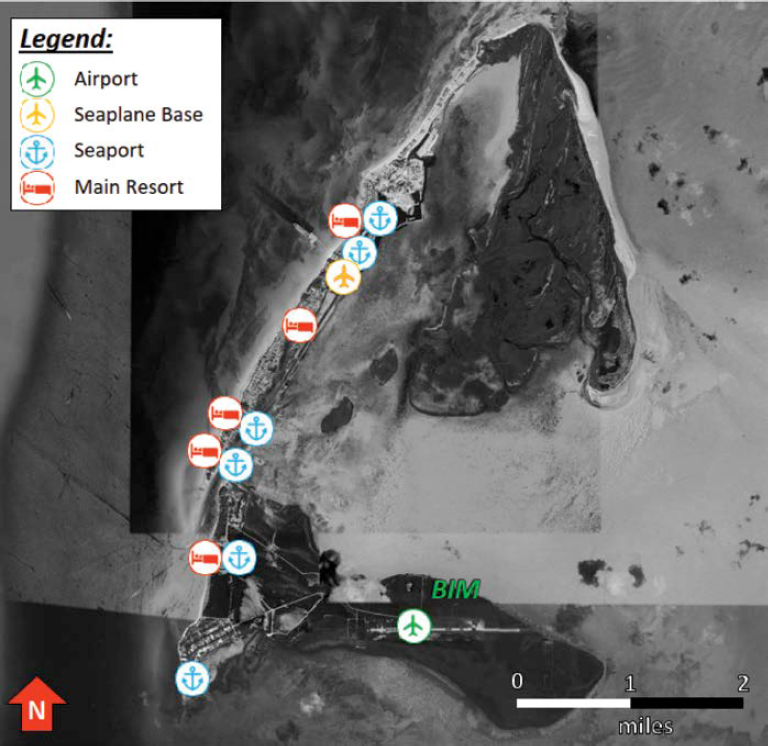
Bimini is a group of three islands in the western part of the Bahamas, located 50 miles east of Miami, Florida. North Bimini is home to famous resorts; South Bimini is more residential and has an aviation facility that accommodates small general aviation aircraft, turboprop aircraft, and small regional jets (Figure 112). There is no bridge between North Bimini and South Bimini. When visiting Bimini, tourists commonly set their trip by booking a hotel that usually provides the transportation from the airport to the resort via seaplanes. These hotels have private seaports, which they use to provide additional amenities to their customers that include seaplane transportation to different parts of Bimini.
Similarly, the Maldives, a small archipelagic state in South Asia in the Indian Ocean, utilizes these transportation modes too. It is popular to get to the Maldives via seaplane because of the convenience when traveling there. More than 120,000 seaplane flights happen every year at this destination. Speedboats are used to access seashore areas not reachable by seaplanes.
Seaplanes are compact and can carry up to 15 passengers around the more than 1,200 atolls of the Maldives that are within reach by seaplane (Figure 113). Seaplanes in the Maldives fly low, sometimes very short distances (as fast as five minutes when island hopping between nearby resorts), and they do not have pressurized cabins.
Mobility in Silicon Valley, California
Context
The San Francisco Bay Area is notorious for the congestion of its roadway system at peak hours. The presence of major tech giants, including Apple, Google, and Microsoft, has increased the intense commute to Silicon Valley in San José and Santa Clara. A study conducted in 2016 by the University of California, Los Angeles Institute of Transportation Studies, reported five factors that contribute to the congestion experienced in the Bay Area:
- Population and/or job growth rates that exceed the growth of road supply.
- Increasing incomes and/or decreasing auto-operation costs.
- Concentration of economic activities in locations and at times that concentrate traffic flows.
- Low-density/auto-oriented development.
- Limited alternative to motor vehicle travel.
Pre-pandemic traffic rankings from TomTom, a Dutch company that sells navigation equipment, consistently put San José as the fifth worst traffic in the U.S. and San Francisco as second worst in the U.S.
According to the Silicon Valley Institute for Regional Studies, 21.2 percent of people working in Silicon Valley were living outside of it in 2015, and almost 75 percent of commuters in Santa Clara County chose to drive alone in 2019.

Public Transportation
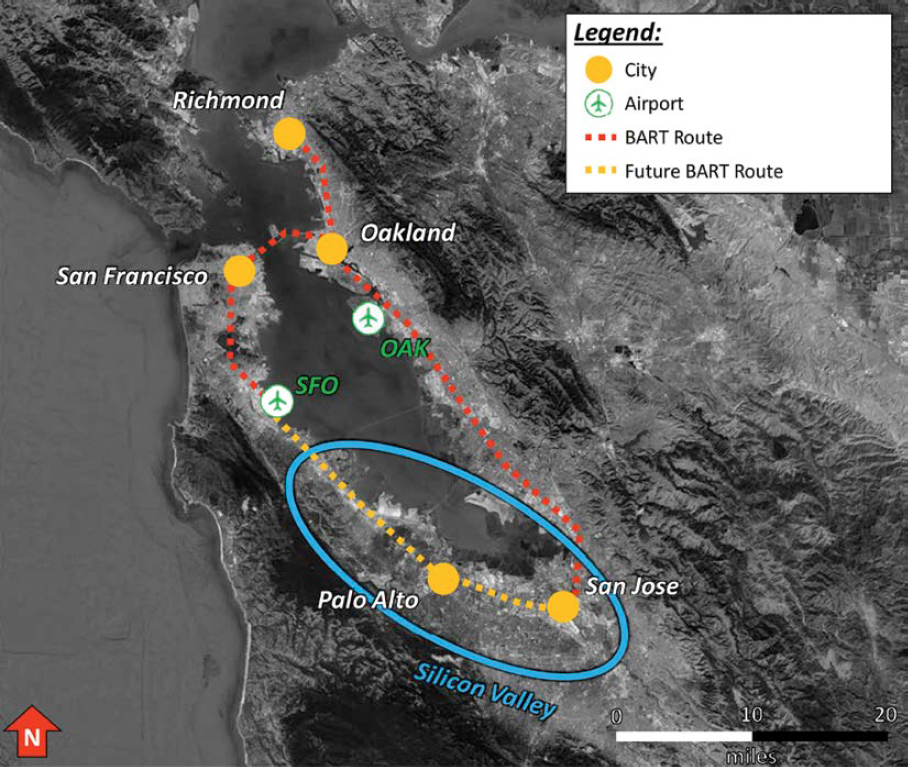
To alleviate traffic, the Valley Transportation Authority (VTA) has developed mass transit options for commuters, with regional rail (BART), light rail, bus, and commuter trains. The BART system connects the Bay Area with services to San Francisco, Oakland, East Bay, and an extension to Silicon Valley which is under construction (Figure 114). Caltrain (regional train) provides rides from Gilroy to San Francisco and passes directly through Silicon Valley.
The light rail, by contrast, has a more limited scope of service within San José and Silicon Valley. The bus system is more robust, with two bus services provided by VTA and SamTrans. The VTA bus extent is primarily within Silicon Valley, with a denser network of stops in and immediately surrounding Downtown San José. SamTrans has a larger network of stops expanding out to 16 cities; however, the network is not particularly dense in terms of stops. Though these options exist, there is a lack of integration between the different transportation networks. This makes it difficult for users to combine rides with different operators to get where they need to go, making it a potential case for mobility-as-a-service (MaaS).
Example of Internal Mobility
Google offers a shuttle service to pick up and drop off employees from work (Figure 115). The shuttles carry 37 passengers each, and the routes extend over six counties. During peak periods, pick-ups can be as frequent as every 15 minutes. The shuttle service utilizes the highway
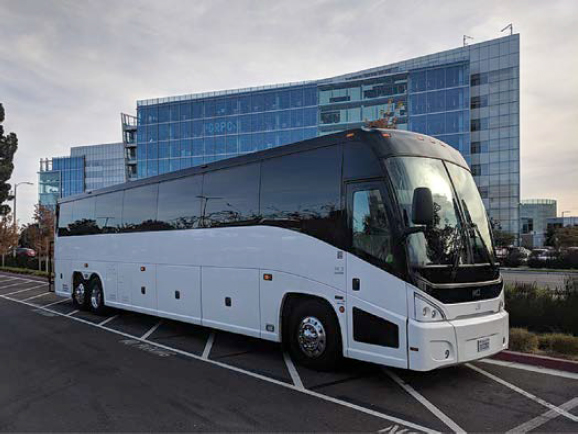
Source: Photo by Grendelkhan, 2018
network and carpool lanes to ferry Google employees to and from work. In 2014, the Google fleet operated 100 buses on 40 routes across the Bay Area, carrying about 4,000 passengers a day from seven Bay Area counties as posted in the Los Angeles Times (O’Brien and Guynn 2014). Google is noted to have investigated PRT, according to Fulton’s (2012) article in California Planning & Development Report, as a potential solution for its employees on the Silicon Valley campus, but ultimately this alternative was not selected. Facebook stated that Facebook shuttles transported more than 6,000 people on 80 routes daily in 2020. Microsoft also offers similar employee shuttle rides.
Walt Disney World, Lake Buena Vista, Florida
Context
Walt Disney World (WDW) is an entertainment resort and theme park complex in Lake Buena Vista, Florida, developed and operated by The Walt Disney Company. Announced in 1965 as the Florida Project, the complex opened to the public in 1971 with the completion of its first theme park, Magic Kingdom. Today, WDW is home to six theme and water parks, 34 resorts and hotels, and several other attractions and facilities. During its first year of operation, about 10 million visitors visited it. In 2019, before the COVID-19 pandemic, the complex accommodated nearly 59 million people. In addition, over 77,000 employees work at the facility, making it the largest single-site employer in the United States. Finally, the operations of such a facility rely on complex supply chains to provide food and beverages, merchandise, parts and equipment, as well as utilities.
Ground Access
Visitors can access the site by car from Interstate I-4, FL-417, FL-429, and Florida’s Turnpike (via FL-417). Hotels and resorts operate buses from Orlando International Airport. Shuttles can be booked from other airports in Greater Orlando and Tampa (e.g., Kissimmee Gateway Airport [ISM], Orlando Sanford International Airport [SFB], TPA). The Central Florida Regional
Transportation Authority operates LYNX public bus routes from different points in Greater Orlando to Disney Springs, Magic Kingdom, and the Transportation & Ticket Center, a transportation hub to access or connect between WDW’s theme parks. Supplies are delivered by truck.
Brightline, a privately owned intercity passenger-rail route operator, has plans to expand its high-speed railway to Disney Springs in 2026. This service will be the continuation of the service between Miami and West Palm Beach, recently extended to Orlando International Airport. It started operations in 2023. Ultimately, the railroad is planned to be expanded to downtown Tampa.
Air Access
Initial plans for the Florida Project featured a privately owned commercial service airport—the “Airport of Tomorrow”—that would have been located between the Interstate I-4 corridor and West Irlo Bronson Memorial Highway (US-192). A monorail would have connected the airport to the complex. Ultimately, the final plan dropped the privately owned airport in the late 1960s with the rise of Orlando Jetport at McCoy Air Force Base (today known as Orlando International Airport).
However, a small aviation facility was built in 1971 near what is now Experimental Prototype Community of Tomorrow (EPCOT) Center. Walt Disney World Airport (DWS), also known as Lake Buena Vista STOLport, was operated for a few years. Between October 1971 and December 1972, three airlines provided regular service at different periods. Shawnee Airlines and Executive Airlines operated regular nonstop service with DHC-6 Twin Otters to Fort Lauderdale, Orlando Executive Airport (ORL), Tampa, and West Palm Beach. VQ Airlines by Volusia Aviation Service used Beech Bonanzas and a Piper Cherokee to Orlando Herndon and Daytona Beach. These routes were no longer operated starting in 1973, and the STOLport was closed that year. The infrastructure still exists, but the site is used for storing equipment and vehicles.
This experiment can be seen as an early version of what VTOL/STOL aircraft operations could offer to the park in terms of connectivity as part of an advanced air mobility network in Central Florida.
Internal Mobility
Disney Transport is a division of The Walt Disney Company that operates the public transit system of Walt Disney World. Each park is served by large parking lots. For instance, Magic Kingdom’s parking lot alone has a footprint of over 125 acres and has a capacity of 12,000 cars. From the parking lots, visitors can join the park entrances by foot or use high-capacity compressed natural gas–powered carts—or trams—that can accommodate over 200 passengers each.
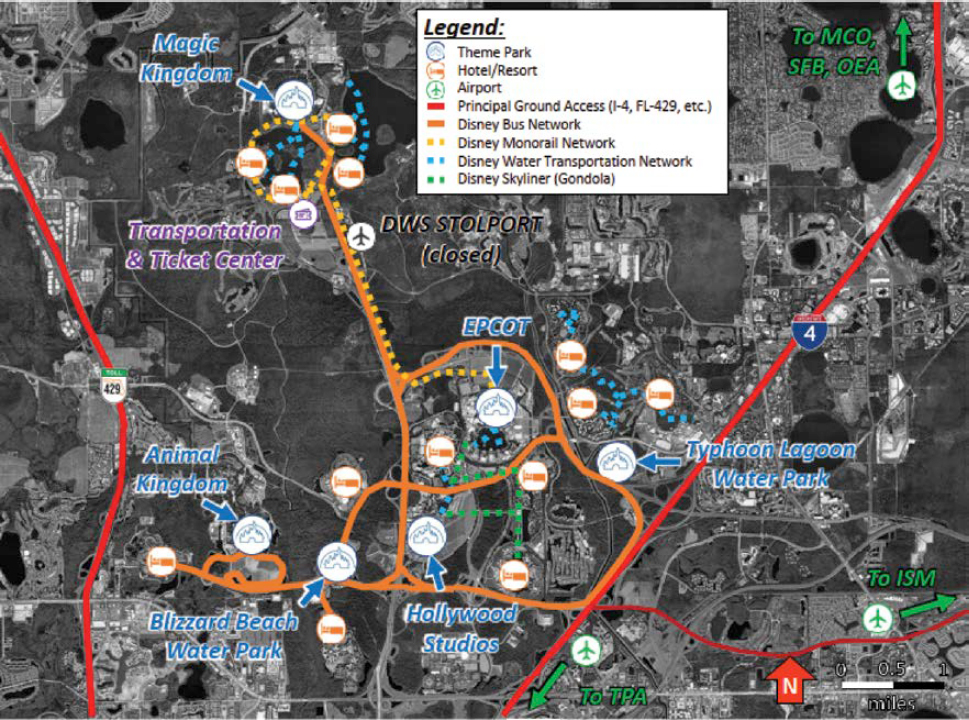
From the park entrance, different modes are available to move in and between the different parks, resorts, and individual attractions. The monorail system transports over 150,000 daily riders on a network of three lines and six stations. The Disney Skyliner is a three-line gondola (cableway) system that opened in 2019. The Skyliner serves to connect the different resorts to the EPCOT Center’s monorail station. Ferries and water taxis provide connections across the Seven Seas Lagoon, Bay Lake, Crescent Lake, and Disney Springs. Bus lines are operated throughout the complex, some of them in parallel to the aforementioned modes. Figure 116 depicts the transportation systems and routes available at Walt Disney World.
From EPCOT to Celebration: Car-Free Planned Communities
In the 1965 Florida Project, Walt Disney envisioned EPCOT, a 20,000-inhabitant city that would have been his blueprint for the ideal city of tomorrow. The Walt Disney Company would
have controlled this community. Urban mobility would have been provided by the WEDway PeopleMover, an automated guideway transportation system that could carry up to 20 people in cars of 2 to 4 passengers. This technology, developed by the R&D branch of The Walt Disney Company (known today as Walt Disney Imagineering Research & Development, Inc.), is in operation at the Tomorrowland theme park of WDW. In EPCOT, this system would have replaced cars. The city would have been connected to the monorail network of WDW. Plans for the private city were eventually dropped by the company after Walt Disney passed away. However, “EPCOT Center” was opened in 1982 as a theme park about technology and innovation as well as the World Showcase attraction.
In the 1990s, a smaller planned community—called Celebration—retaining some of the ideals of EPCOT was developed on land formerly owned by The Walt Disney Company. Celebration is now an unincorporated, independent, and homeowners’ association–managed community with over 11,000 residents. Celebration enables a car-free way of life, with a downtown in walking distance from condominiums, a network of bikeways, as well as driveways for electric golf carts used by many residents as an alternative to cars.
Expanding Accessibility in Rural America
Context
According to the U.S. DOT, rural communities are a core component of the American economy. Over 69 percent of the nation’s road miles are in rural areas, totaling over 6 million miles. Even though rural communities are a large part of the economy, they face major challenges regarding
transportation. Moreover, demand for regionally focused and connected public transit solutions are increasing. In 2021, according to Bureau of Transportation Statistics (2023) data, 29 percent of rural residents did not have access to bus transportation, and 59 percent did not have access to intercity rail transportation.
Rural transportation infrastructure is crucial for the movement of goods and connectivity with commercial markets. Transportation infrastructure can amplify the quality of life in rural areas by improving connectivity, mobility, and access to basic services, including education and healthcare. In 2022, U.S. DOT announced grant funding totaling $300 million for that fiscal year for transportation projects that would support the economic development of rural areas nationwide. This is particularly due to rurality revival, where numerous people from large expensive metropolitan areas decided to move to smaller communities after the COVID-19 pandemic.
Need and Policies
According to the article “Meeting the Transportation Needs of Rural Communities: Lessons That Cannot Be Learned from Urban Transit” published in TR News 325 (Schauer 2020), rural transit has been available for about 50 years, which is short compared to urban transit. Rural transit, unlike urban transit, does not have prescribed federal planning requirements for developing a transit development plan. The article also states that the historical inequity in the distribution of funds compared to urban planning has been emphasized since the mid-1960s. To address the issue, the Older Americans Act of 1965 was passed to help set up some accessibility in rural communities. A variety of subsidized services were implemented, like buses and even private taxis. The original legislation established authority for possible grants with the purpose of community planning and social services, and it also provided the Administration of the Aging to manage these grants that were now going to be available for this population. Since then, it has proven to be challenging to define rural public transit without federally mandated planning practices. Rural public transit has functioned partially as a social service. The purpose of rural transportation is to enable people to sustain their lives independently without transportation as an obstacle. Early implementation of rural transit attempted to address passenger travel needs by providing timely solutions; however, these solutions were developed without community input and evaluation, which could have provided more effective long-term solutions. The organizations in the early phase of rural transit have tried serving the purpose by providing timely solutions to passengers’ needs without evaluating the community needs to plan long-term solutions successfully.
Scheduled Rural Public Transit: Operating Above the Standard in Missouri
The most extensive rural public transit system in the nation is Missouri’s Operating Above the Standard (OATS) program (previously the Older Adults Transportation Service, now formally titled Operating Above the Standard). OATS is operated by a nonprofit corporation, OATS Transit, and has been the most successful demonstration approach. Its current size includes 800 vehicles and 700 employees providing services in 87 counties throughout the state, with 1,025,692 trips provided in 2020. Furthermore, connectivity to other medium- to long-range means of transportation are provided through stops at airports (STL, Kansas City International Airport [MCI]), Amtrak stations, and bus terminals (Figure 117). The validation of needs and demands was formalized through the Federal-Aid Highway Act of 1973, Section 147, the Rural Highway Public Transportation Demonstration Program. The act was the first federally funded initiative for
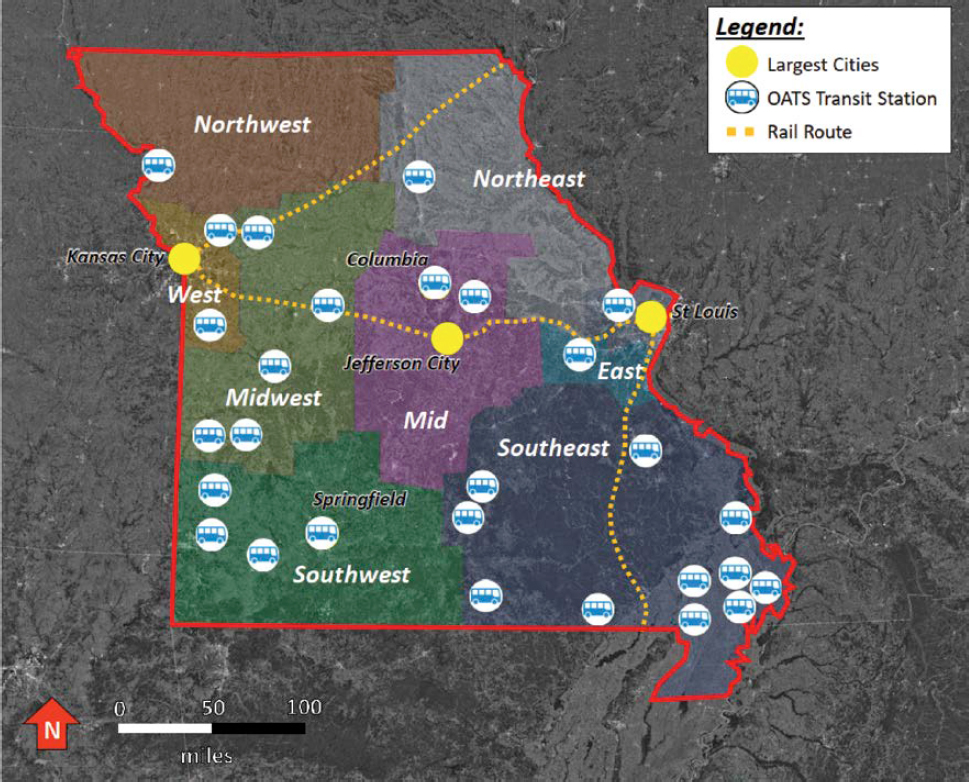
Source: Missouri Department of Transportation, 2022
rural transit and recognizes the transportation needs of rural America as a legitimate part of the nation’s emerging transportation policy.
On-Demand Transit in Rural Communities
The OATS model described previously is not suitable for most rural transit systems, as the population they serve may not be sufficient to warrant a cost-effective implementation of fixed-route bus or train lines. At the same time, private car ownership rates are correlated with household income—rural counties tend to have lower incomes—thus, rural residents may not have reliable means to travel to and from work, further aggravating the urban-rural divide in the United States. However, the success of on-demand mobility in urban areas has driven local governments to explore implementing “on-demand” shared transport, such as the Valdosta On Demand and WeGo services covering the Georgia cities of Valdosta and Gainesville, respectively. Local administrators of these programs have stated that their ridership has exceeded that of their scheduled bus route counterparts. In these cases, riders can either hail a ride from an app or through a phone call and then meet drivers at “virtual” bus stops to board transport vehicles, with advance payment through either vouchers or credit cards. Implementing systems like these appears to reduce operating costs for small towns while providing economic opportunity and promoting access for all through better connectivity.
Addressing Transportation Challenges During the Olympic Games
Context
When hosting the Olympic Games, cities must face mobility challenges for both spectators and national delegations. While the need to transport the latter is often temporary due to the Olympic Village, cities may take advantage of the dynamics of this event to plan and make investments—in coordination with public transportation entities—to create or upgrade their mass transit networks. In addition, global events such as these have been, are, and will be opportunities for local governments to experiment with new transportation technologies.
Upgrading Local Transportation Systems
The Rio de Janeiro 2016 Olympics saw a major investment in bus rapid transit (BRT) as a primary mode of transportation for spectators. BRT is a popular mass transit option in Brazil. Three BRT corridors were built to accommodate the extra demand during the Games (Figure 118). These corridors were built as a tie-in to the public transportation network for post-game transfer to civic use. A new light rail line or vehicle rail system, VLT, connected attendees from the airport to the city with airport carries. The VLT made connections to the metro rail network and the bus system. To assist with interoperability, a travel pass (RioCard) could be used on any of the transportation networks. During the Olympic Games, anyone with a RioCard also had exclusive
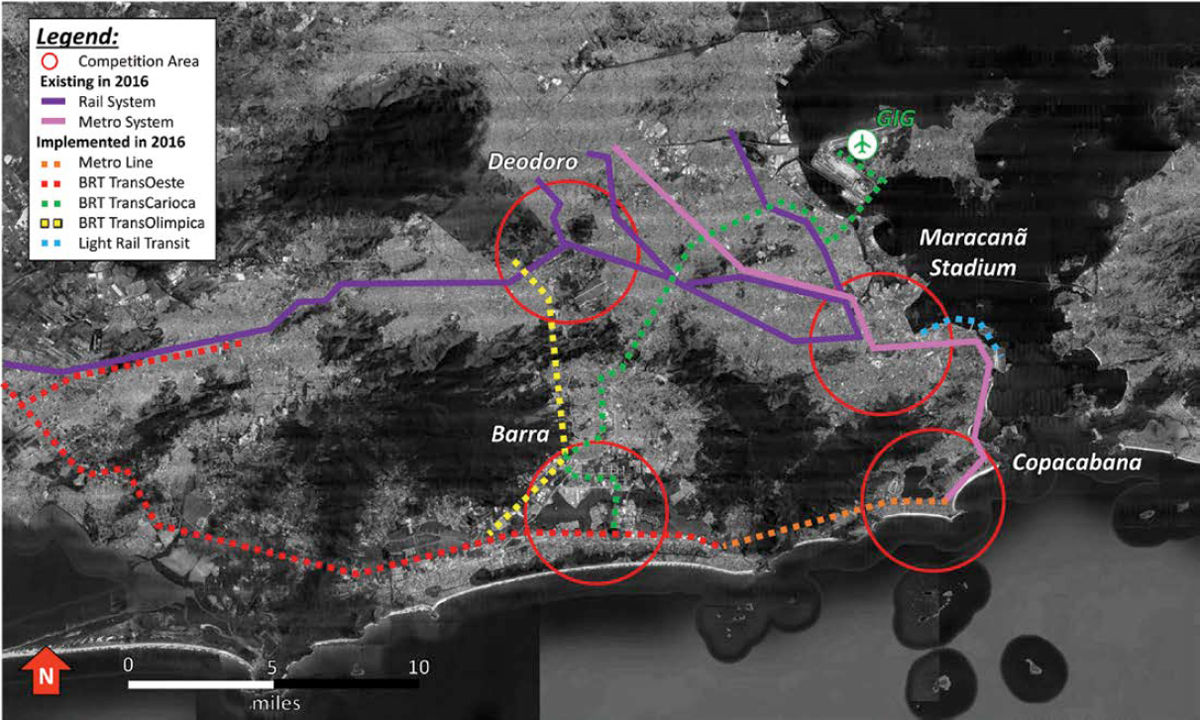
Note: GIG = Rio de Janeiro/Galeão–Antonio Carlos Jobim International Airport.
access to the TransOlimpica BRT corridor line and Line 4 on the metro. For the transportation of athletes, the media, and other Olympic groups was a volunteer shuttle service which provided dedicated highway lanes to the Olympic-branded vehicles.
During the London 2012 Olympics, London made use of its existing public transit network to ferry athletes and spectators alike. Each Olympic Games ticket came with a free travel card to use on the Tube (underground rail network) and the Docklands Light Railway. In addition to these public transit systems, the London Games implemented Games Lanes on approximately 30 miles of key London roads. The Games Lanes were only for specific people who were crucial to the successful running of the Games:
- Athletes
- Media
- International Olympic and international Paralympic committees
- Games partners and guests
Experimentation with New Transportation Technologies
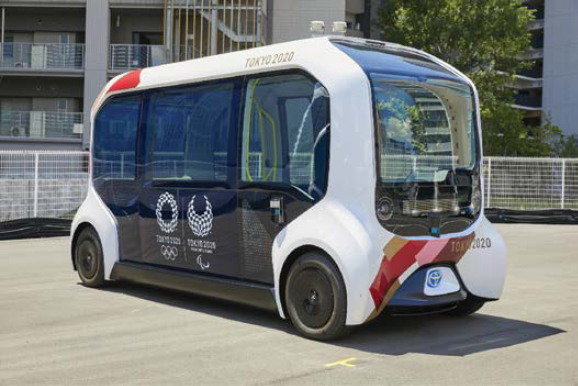
During the Tokyo 2020 Olympics, automated vehicles were in use primarily for assisting with the transportation needs of staff and athletes (Figure 119). Approximately 20 e-Palettes were used during the Games. The e-Palettes transported up to 20 athletes and staff around the Olympic and Paralympic Villages and were used as a “last-mile” transportation option to complete an athlete’s or official’s journey. These automated vehicles were specially designed for use in Tokyo and were circulating on marked roads only in Tokyo.
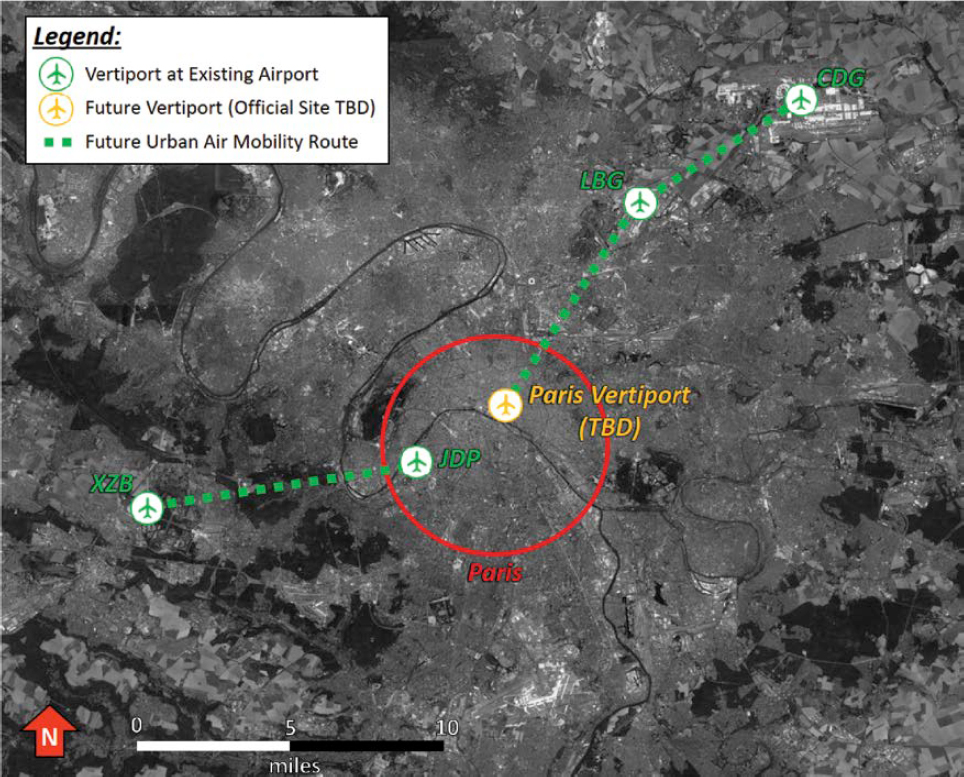
For the Paris 2024 Olympic and Paralympic Games, efforts are underway at the time of this writing to study the feasibility of an urban air mobility program for two potential routes: one linking Paris Charles de Gaulle Airport (CDG) and Paris-Le Bourget Airport (LBG) to Paris (exact site to be determined) and the other between the Issy-les-Moulineaux Heliport (JDP) and Saint-Cyr Airfield (XZB) (Figure 120). The development is led by Groupe ADP, Airbus, the Régie Autonome des Transports Parisiens (RATP) Group, Paris Ile-de-France Region, and the French Civil Aviation Authority.
Initial testing and building of the vertiport will take place at Groupe ADP’s Cergy-Pontoise Airfield in Paris. The vertiport is being built using a modular design for easy transfer to the City of Paris, where it will be moved for its debut at the 2024 Olympic Games.
The Los Angeles 2028 Olympic and Paralympic Games are similarly looking at urban air mobility to solve transportation issues for the Games. It is expected that the first flying taxi will be certified by 2024 and Mayor Eric Garcetti has welcomed the idea, launching the nonprofit Urban Movements Lab in 2019 to accelerate new mobility technologies. Currently, conversations around the advanced air mobility technology in Los Angeles center around nighttime restrictions, the disparity and meaning of wealthy passengers flying over poor neighborhoods, and noise level of the flying taxis if many are flying at once.
World’s Fairs: Welcoming the World and Showcasing Innovations
Context
A world’s fair is a large international exhibition whose purpose is to showcase the achievements of nations. These exhibitions are held at a specific site for a period of time–typically between three and six months. The latest world’s fairs held in the United States were Century 21 in Seattle, Washington (1962); the 1964 New York World’s Fair; HemisFair ’68 in San Antonio, Texas; Expo ’71 in Spokane, Washington; the 1982 World’s Fair in Knoxville, Tennessee; and the 1984 World’s Fair in New Orleans, Louisiana.
Early Access Challenges at the 1855 and 1900 Paris International Exhibitions
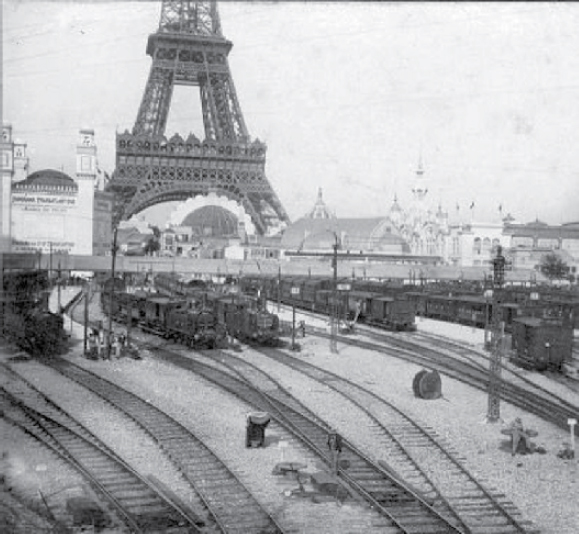
Some world’s fairs have seen original transportation solutions being implemented because the site selected for the event was not adequately served originally, the existing transportation system did not provide for the expected crowd, or the fair itself was regarded as an opportunity to showcase innovative transportation technologies. For the 1855 Exposition Universelle in Paris, France, a 2-mile-long train line was created to transport visitors throughout the exhibition. The large Champ de Mars-Tour Eiffel train station was built a few years later, initially for the sole purpose of receiving the supply and equipment needed for the 1867 Exposition Universelle (Figure 121).
1964 New York World’s Fair
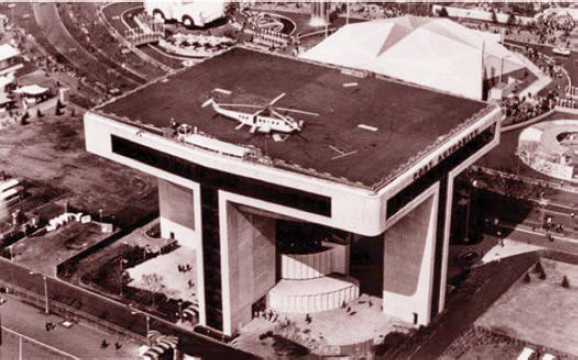
An elevated heliport was featured on the rooftop of the Port of New York Authority Heliport and Exhibit Building at the 1964 New York World’s Fair (Figure 122). The large structure accommodated heavy helicopters serving Manhattan as well as the airports of Greater New York. While the heliport is no longer active, the building still exists and is located at Corona Park on 111th Street in Corona, New York.
Conclusion
The case studies outlined in this appendix are successful implementations of emerging transport and ground access technologies, both in the United States and worldwide, that provide tangible convenience and lifestyle benefits to commuters, tourists, and local communities. In some of these cases, local airports have been already integrated into these transit schemes
(such as San Francisco and Oakland airports having access to BART), strengthening the symbiotic relationship between these airports and the communities they serve. Table 41 summarizes the case studies shown in this appendix.
Furthermore, the results of the case study on transporting visitors to, from, and within Walt Disney World should be studied and improved upon in other parts of the United States and worldwide, as 11 cities in the United States will serve as host cities for the 2026 FIFA World Cup. Strategies adopted for other large sporting events, such as the Tokyo 2020 and Paris 2024 Olympics, should also be observed. Enhancing ground access at airports nationwide through some of these technologies (micromobility, bus, and ridesharing) can be carried out with minimal infrastructure changes, while airport owners desiring to incorporate larger technologies (such as trains and BRT) shall engage with their cities’ transit departments to determine the best course of action for introducing these technologies at their facilities.
“Next-step” technologies, such as CAVs, were not considered in this appendix as they are still emerging, and there few or no lessons learned from airport and non-airport applications. However, interesting early case studies may develop in the years to come that should help airport operators assess how to best integrate these technologies in the future.
Table 41. Case Study Summary Table
| Case Study | Type | Location | Micromobility | Non-guided Transportation Systems | Guided Transportation Systems | Air & Water | |||||||||||||
|---|---|---|---|---|---|---|---|---|---|---|---|---|---|---|---|---|---|---|---|
| Pedestrians | Bikes/E-bikes/E-scooters | Moving Sidewalks | Conventional Vehicles | CAVs | AVs | Public Buses | BRT | PRT | MRT | Light Rail | Commuter/Regional Rail | Intercity/High-Speed Rail | Hyperloops | Cableways | AAM | Water | |||
| Walt Disney World | Theme Parks and Resorts | Lake Buena Vista, FL | |||||||||||||||||
| Rural Communities | Community | Missouri | |||||||||||||||||
| Train Stations | City | Penn Station, NY | |||||||||||||||||
| Port of Miami (Cruises) | City | Miami, FL | |||||||||||||||||
| Silicon Valley | Community | California | |||||||||||||||||
| West Virginia University | Campus | Morgantown, WV | |||||||||||||||||
| Olympic Games | Sports Events | Brazil | |||||||||||||||||
| London | |||||||||||||||||||
| Tokyo | |||||||||||||||||||
| Ski Resorts | Resorts | Park City, UT; Breckenridge, CO | |||||||||||||||||
| World’s Fairs | Events | Multiple locations | |||||||||||||||||
| Hotel Resorts | Islands | Bahamas and Maldives | |||||||||||||||||
Note: Green = In service; Red = Decommissioned; Blue = Planned; Yellow = On-site mobility only; Gray = Not applicable or not available.


