Enhancing Airport Access with Emerging Mobility (2025)
Chapter: 9 Sustainability and Environmental Considerations
CHAPTER 9
Sustainability and Environmental Considerations
Context
Transportation infrastructure has both positive and negative impacts on the environment and the communities surrounding it. For example, individuals and businesses may be displaced to construct infrastructure, but the benefits of the infrastructure to communities have varying degrees of value. Also, public transportation can decrease emissions per individual passenger because any mode of public transit will generally have a higher passenger density than a private vehicle. Historically, transportation planning and infrastructure development practices in the United States did not necessarily create access for all, and certain communities were more negatively impacted than others. These negative impacts are well documented (U.S. Department of Transportation 2023; Thomas et al. 2022).
Weather Vulnerability and Resilience
Ground Transportation Vulnerability
Ground transportation is vulnerable to climate change in a number of ways:
-
Extreme weather events: Extreme weather events can have a significant impact on transportation infrastructure and services, leading to disruptions and increased repair costs. Examples of extreme weather events include
- – Heavy rain, which can cause flooding that washes out roads, rails, and bridges, making them unsafe or unusable for travel;
- – Wildfires, which may damage infrastructure or reduce visibility due to smoke; and
- – Heavy snowfall, which can cause infrastructure closures and transportation delays.
- Sea level rise: The rise in sea level can have a significant impact on ground transportation and infrastructure, particularly in coastal regions. Coastal highways, rails, and bridges may become inundated with water, making them unsafe for travel. In addition, saltwater intrusion from the sea can damage transportation infrastructure, leading to increased repair costs and reduced transportation capacity.
- Increased temperatures: Higher temperatures can cause pavement to soften and expand. This can create rutting and potholes, particularly in high-traffic areas, and can place stress on bridge joints. Heat waves can also limit construction activities, particularly in areas with high humidity, and may lead to increased energy consumption and emissions through the increased demand for air conditioning and cooling systems in vehicles.
Since airports are essential to regional transportation plans, the regional planning commission frequently collaborates with airports to produce regional plans and policies. Understanding how ground transportation networks are impacted by climate change may also help the airport detect
new risks. According to Dewberry et al. (2015), some concerns about the impact of climate change on airport transportation include
- How to accommodate airport workers who are essential to operations during extreme events but unable to go to the airport (many of these workers are from low-income and underserved communities); and
- If roads close to the airport are inaccessible during a snow or ice storm, airport inbound passengers may become stuck at the airport and outgoing passengers may not be able to leave.
Extreme Weather Resiliency
Extreme weather resiliency has become a critical issue in transportation planning and policymaking with challenges to the safety, accessibility, and efficiency of transportation systems. Building resilience and adapting to climate change is essential to ensure that transportation systems can continue to work under a wide range of weather and climate conditions. Building resilience includes developing adaptation strategies, such as structural, nonstructural, asset-specific, and regional adaptation measures (Metropolitan Transportation Commission et al. 2011).
- Structural: These measures refer to physical changes to infrastructure that can help protect against extreme weather and sea level rise. Examples include elevating or relocating infrastructure.
- Nonstructural: These measures refer to nonphysical changes, behaviors, or policies that can help reduce vulnerability to climate change. These measures can include changing regulations (e.g., new building codes or zoning requirements, like setbacks or buffer zones), updating design guidance, and public education campaigns to raise awareness and make communities more resilient. Nonstructural measures could also include rerouting traffic or temporarily closing infrastructure.
- Asset-specific: These measures focus on protecting particular assets, in this case transportation infrastructure, from the impacts of extreme weather. Examples include building levees and seawalls.
- Regional: These measures address the unique risks and challenges faced by specific regions and communities that seek to protect more than one transportation asset and assets in other sectors (e.g., residential, commerce, recreation) in the same area.
Case Studies
New York City.
The Resiliency Planning & Management team of the NYC Department of Transportation (NYC DOT) oversees the design and execution of resilient infrastructure projects and is in charge of developing the agency’s resilience policy and guidelines (NYC Department of Transportation 2023). The team also relies on comprehensive Climate Resiliency Design Guidelines aimed at addressing the potential impacts of climate change on the state’s transportation infrastructure and ensuring that future projects can withstand the identified climate threats for capital projects (NYC Mayor’s Office of Resiliency 2020). The plan is a proactive response to the growing threat of climate change and its associated effects.
The city has faced some vulnerabilities, including Hurricane Sandy in 2012, which caused significant damage to transportation infrastructure due to wave action and seawater infiltration, and Hurricane Ida in 2021, which brought a record-breaking rainfall of 7 inches that led to transport services being suspended, leaving thousands of New Yorkers stranded (NYC Department of Transportation 2023).
In the future, as effects of extreme weather continue, the city is expected to see up to 6 feet of sea level rise by the end of the century and experience increased temperatures and heat waves
during summer months, which would significantly impact the road and rail infrastructure (NYC Department of Transportation 2023).
NYC’s adaptation measures can be divided into asset-specific, structural/regional, and nonstructural measures:
-
Asset-specific adaptation measures:
- – Raising roads.
- – Relocating roads.
-
Structural adaptation measures (can double as regional adaptation measures):
- – Building seawalls/floodwalls.
- – Implementing new cloudburst and green infrastructure projects to convey, detain, and store stormwater.
- – Reducing urban heat island effect by methods such as vegetated structures (trees), green roofs on facilities, and light-colored pavement materials, coatings, and sealants.
-
Nonstructural adaptation measures:
- – Modification to roadway design guidance.
- – Assess tidal inundation due to sea level rise.
- – Access and address risks in the current floodplain.
- – Access and address risks in the future floodplain.
San Francisco Bay Area.
The San Francisco Bay Area consists of nine counties with shoreline communities connected to one another, the rest of the region, the state, the country, and the world by transportation infrastructure, including freeways, seaports, railroads, airports, local roads, mass transit, and bicycle and pedestrian facilities. Current projections show that climate change will lead the bay to rise by 1.3 feet by midcentury and 4.5 feet by the end of the century (Coastal and Ocean Working Group for the Climate Action Team 2010). This implies that locations that currently flood every 10–20 years will flood considerably more frequently and that the floods of today will be the high tides of tomorrow. Flooding and the several immediate effects that follow it will significantly affect the city, including its transportation systems.
The Metropolitan Transportation Commission; California Department of Transportation, District 4; and San Francisco Bay Conservation and Development Commission teamed up on a subregional planning pilot project to test the conceptual risk assessment model created by FHWA to evaluate the risks to transportation infrastructure from sea level rise associated with climate change in a specific section of the San Francisco Bay Area.
The project’s adaptation measures were divided into a number of categories, including asset-specific, structural/regional (non-asset-specific), and nonstructural measures:
-
Asset-specific:
- – Raise road surfaces.
- – Drainage improvement.
- – Retrofit by placing water-sensitive components (e.g., wiring and electronics) above a specific flood height or waterproofing components.
-
Structural (can double as regional adaptation measures):
- – Construct floodwall.
- – Create a berm or levee, which allows for future adjustments.
- – Support wetland growth to lower flood heights by absorbing wave activity.
-
Nonstructural:
- – Change building codes and design guidance to accommodate the sea level rise.
- – Transition to proactive planning to make adapting to increasing sea levels easier.
- – Explore multi-jurisdictional partnerships to share costs or implement structural solutions required to address the vulnerabilities and risks identified.
Air Quality
Emissions
While ground access modes provide convenience and comfort for travelers utilizing airports, they also produce emissions that can have a negative impact on the environment. The transportation sector accounted for approximately 27 percent of the total emissions in 2020 (U.S. Environmental Protection Agency 2022). With the increasing demand for air travel, airport ground access modes are an important category of transportation emissions to reduce. Each mode of transportation has a different level of emissions and thus a different impact on the environment, as described in the following sections.
Micromobility
This mode of transportation is typically human or battery powered, which gives micromobility the potential to provide an alternative to cars and other motorized vehicles. In fact, 37 percent of the total shared micromobility trips taken in North America replace car trips (North American Bikeshare & Scootershare Association 2022). Human-powered modes have no emissions since they are powered by the rider’s own energy. Battery-powered modes primarily depend on the source of electrical energy used to charge them. Electricity generated from renewable sources has low to no associated emissions. Furthermore, when looking at the life cycle of shared micromobility, there is a concern for battery disposal and waste and the net effect of emissions.
Connected and Automated Vehicles
These vehicles have the potential to reduce emissions in several ways. Since they are connected and automated, connected and automated vehicles (CAVs) can improve traffic flows and reduce congestion, which can lead to fewer emissions caused by vehicles idling in traffic. Additionally, CAVs can be equipped with sensors that measure air quality, enabling vehicles to take alternate routes that minimize emissions.
Conventional Buses
Buses can provide an efficient, low-emissions alternative to personal automobiles. Diesel engines, which power the majority of the global bus fleet, generate high nitrogen oxide (NOx) emissions. As stated previously, the electrification of buses can help to reduce these emissions. Nordelöf et al. (2019) compared emissions between all-electric, hydrogenated vegetable oil, and diesel fuel vehicles and found that electric buses had the best potential to reduce airborne pollutants, depending on the source of the electricity. BloombergNEF’s (2018) report noted that emissions from the operation of battery-electric vehicles (BEVs) were about 39 percent lower on a per kilometer basis than those from average internal combustion vehicles.
Bus Rapid Transit
Bus rapid transit (BRT) systems usually have lower emissions per passenger compared to conventional bus systems due to their efficient use of resources like fuel and electricity. Similar to the conventional bus system, BRT systems transport more people than personal automobiles, thereby reducing the number of cars on the road and associated emissions. However, the actual emissions from the BRT system depend on the specific technology and infrastructure used, as well as the bus’s power source.
Personal Rapid Transit
Personal rapid transit (PRT) systems typically use small automated vehicles (AVs) that run on electricity, use dedicated guideways, and travel directly to their destination without stopping. Thus, they can be more energy efficient compared to the traditional public transit system. In general, the
emissions from PRT will depend on the specifics of the system, such as the power source, materials in PRT vehicle manufacturing, and materials used to construct the guideways.
Urban Rail
Urban rail systems can reduce emissions per passenger-mile below those associated with single-occupancy vehicles. For instance, when urban rail systems operate at their average occupancy, 0.23–0.36 pounds of CO2 are generated, a reduction in emissions of 63–76 percent compared to single-occupancy vehicles. Operating at capacity can further reduce this range to only 0.10–0.14 pounds of CO2. Lifecycle emissions (including manufacture, repair, fuel, and infrastructure) per passenger-mile for rail systems are, on average, half of those of a sedan car and a third of the emissions of a pick-up truck (Federal Transit Administration 2010).
- Heavy rail: Heavy rail typically has lower carbon emissions per passenger-mile compared to commuter or regional rail and light rail transit (LRT) systems because these systems operate on dedicated trackways that use electricity from low-emissions sources, and they can carry large numbers of passengers.
- Light rail: This mode of transportation has a lower rate of emissions per passenger-mile compared to conventional cars. However, LRT generally has a higher rate of emissions than heavy rail systems due to the system often operating on shared streets with other vehicles, which results in slower speeds and reduced efficiency. Additionally, as with other modes powered by electricity, the source of the electricity can contribute to reduced emissions from this mode.
- Commuter and regional rail: Emissions from commuter and regional rail depend on the type of power source used to operate the trains.
Intercity and High-Speed Rail Service
High-speed rail has lower emissions compared to heavy rail, commuter or regional rail, and LRT systems due to its high-speed operations, thereby reducing the overall energy required per passenger-mile. However, high-speed rail emissions depend on various factors, such as construction and maintenance of the infrastructure as well as the type of energy used to power the vehicle.
Vactrains
Vactrains are still early in development, thus the potential for emissions reduction is primarily speculative. This technology has the potential to reduce the time needed for long-distance travel, which could lead to a decrease in the number of cars and other ground access modes.
Aerial Cableway Technology
As an all-electric system, the aerial cableway uses less energy and its emissions are lower than other transit options (Wahl and Schumacher 2018). With most of its infrastructure suspended in the air and the small footprints of the cable towers, an aerial cableway’s environmental impact can be mitigated through strategic location, especially by avoiding station locations that require the most land and have the highest potential for environmental disturbance.
Advanced Air Mobility
One of the goals of advanced air mobility (AAM) is to reduce environmental impacts of aviation by operating electric vertical takeoff and landing (eVTOL) aircraft, which have part or all of their propulsion system powered by electricity stored in batteries or generated from hydrogen through fuel cells.
Waterway Transportation
Waterway transportation generates compounds such as NOx as well as non-methane hydrocarbons, PM, carbon monoxide (CO), and sulfur dioxide (SO2) that affect local air quality. The emergence of electric vessels can reduce direct emissions as hydrocarbon-based fuel combustion
is eliminated. Fully electric vessels emit few or none of the pollutants that adversely affect local air quality.
Emission Sources in Ground Transportation
Sources of emissions in ground access modes can be grouped into two main categories: direct and indirect emissions.
Direct Emissions
Direct emissions are produced by the combustion of hydrocarbon-based fuels, such as gasoline and diesel, during operation. The amount of emissions produced by a vehicle depends on several factors, including the type of fuel used, the vehicle’s engine efficiency, and driving conditions. Electric vehicles (EVs) do not produce emissions in the same way as vehicles powered by conventional hydrocarbon-based fuel since they do not produce tailpipe emissions; however, the electricity used to charge EV batteries may produce emissions at the power generation source (U.S. Department of Energy 2022).
Indirect Emissions
Indirect emissions are produced as a result of the manufacturing (including mining of raw materials), maintenance, and disposal of the vehicles, as well as the development of infrastructure to support vehicle operation. The production of maintenance and replacement parts and the energy used to power repair facilities can also contribute to emissions.
Carbon Footprint
Carbon emissions from transport systems are measured by monitoring the amount of fuel consumed and using the equivalent carbon conversion factor to calculate the corresponding CO2 emissions. Figure 77 provides an average carbon footprint of ground access modes. Performance metrics are used to compare the carbon emissions of different transportation modes on an equal platform. According to APTA, there are three performance metrics to consider when quantifying
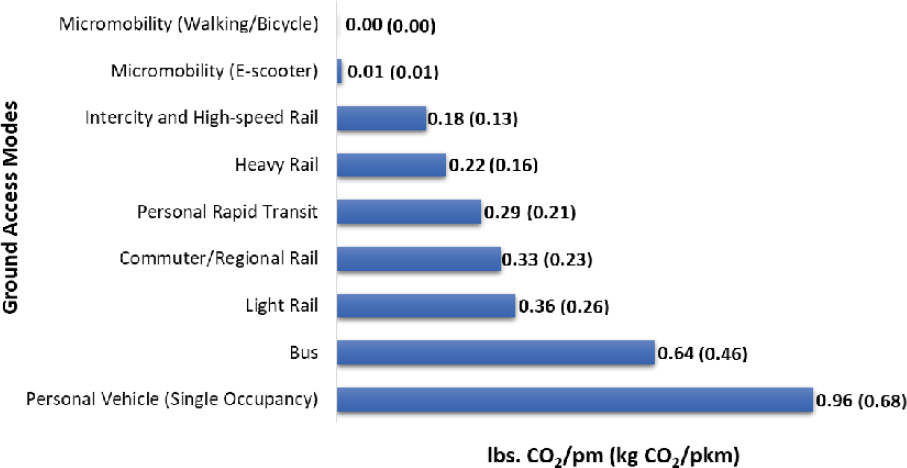
Source: FTA (2010)
Note: lbs. CO2/pm (kg CO2/pkm) = pounds of carbon dioxide per passenger-mile (kilograms of carbon dioxide per passenger-kilometer).
greenhouse gas emissions from transportation systems (American Public Transportation Association 2018):
- Emissions per vehicle mile: This metric refers to the amount of emissions that are released into the atmosphere for each mile traveled by a vehicle. Emissions per vehicle mile primarily measures vehicle efficiency, and it is affected by the efficiency and type of fuel used by the vehicle.
- Emissions per revenue vehicle hour: This metric measures the amount of emissions emitted by a vehicle per hour of revenue service. Revenue service refers to the time during which a vehicle is actively transporting passengers or goods and earning revenue for the operator. This metric is commonly used in the context of public transportation; it considers the usage, age, and technology of the vehicle as well as the route, schedule, and traffic patterns of the service to provide a more accurate depiction of the environmental impact. This metric primarily measures operational efficiency, and it is affected by deadheading and congestion.
- Emissions per passenger-mile: This metric measures the amount of emissions emitted by a transportation mode per mile traveled by a passenger. It considers the number of passengers being transported, service productivity, and distance traveled, and it is affected by changes in ridership and load factors. This metric is the most used since it can be calculated for private or individual vehicles and public transit systems alike.
Steps are being taken to reduce the emissions associated with ground access modes. Many airports are investing in electric buses and shuttles to reduce emissions and installing EV-charging stations.
National Environmental Policy Act
Purpose
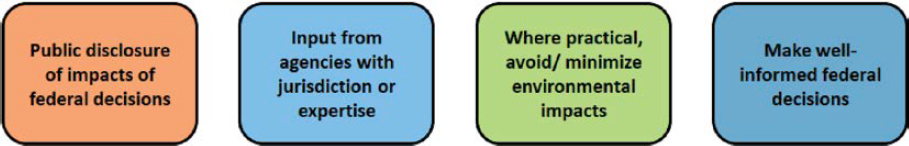
The National Environmental Policy Act (NEPA) is a unique environmental law that focuses on processes and procedures as opposed to standards and regulation. The purpose of NEPA is fourfold, as depicted in Figure 78 and the following numbered list:
- Obtain input from the general public and public agencies with special expertise or jurisdiction over affected resources (e.g., U.S. Fish and Wildlife Service, local air quality agency, and local surface transportation agencies) about impacts of concern.
- Inform the public, agencies that have jurisdiction to make decisions on the project, and the governing decision-maker (FAA, FTA, Federal Railroad Administration, etc.) about the consequences of the proposed projects.
- When possible, work to avoid and minimize impacts.
- Balance environmental impacts with transportation needs when making the decision.
NEPA integrates special purpose laws—including the Clean Air Act, Clean Water Act, and Migratory Bird Treaty Act—into a process that helps to balance the requirements of the special purpose laws and avoid conflicts that might have arisen if these laws were considered independently. The larger the project, the more it benefits from this coordination process.
How NEPA Works
The NEPA process is not triggered by projects themselves but by federal decisions on the projects. In an airport context, this would include any FAA grant money received to fund a project, FAA approval of a change to an Airport Layout Plan (ALP), or FAA approval of passenger facility charges (PFCs). For a cross-agency collaborative project—like an air-rail connection at an airport—it is likely that the grant money, and where it is coming from, will be the trigger for NEPA. In the case of multiple agencies working to complete the NEPA process, a joint NEPA process would be undertaken as a result of the One Federal Decision legislation, typically with the agency with the greatest jurisdiction taking the lead (e.g., on an airport, this would be the FAA). The NEPA process must be completed before the decisions are made; in the case of grant funding, NEPA must be completed before the decision to grant funds is made. In the case of a change to the ALP, FAA grants conditional approval before NEPA and unconditional approval only after NEPA is complete.
The NEPA process involves three classes of actions that project evaluation and examinations can be based on:
- Categorical Exclusion (CatEx),
- Environmental Assessment (EA), and
- Environmental Impact Statement (EIS).
The great majority of projects fall in the CatEx category; this means that, because they are in a category of project that typically does not cause significant environmental impacts, they are excluded from detailed evaluation in NEPA, and a form must be filled out to demonstrate the lack of significant impacts. Every agency has their own CatEx list of projects. EISs are required for projects with significant impacts that cannot be mitigated, rare for the FAA. Projects that are not on the CatEx list and do not require an EIS will be evaluated by an EA. If a project is on the CatEx list but resources are present that may be significantly impacted by the project (also referred to by the FAA as “extraordinary circumstances”), sometimes federal agencies will require an EA.
Figure 79 displays a flowchart on how to determine between CatEx or EA as the class of action.
The timeline for the NEPA process is dependent on the class of action followed. A CatEx has no associated timeline, but it is the quickest process of all three because (a) there are typically few
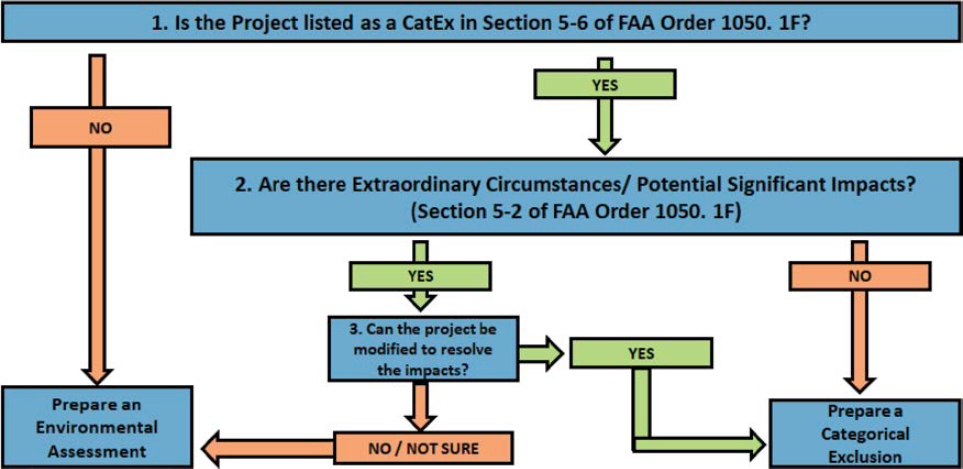
Table 31. Important NEPA Terms
| Term | Description |
|---|---|
| Connected action | A connected action is interdependently involved with the project (the connected action would not occur “but for” another action occurring, or vice versa), and therefore, it must be examined in the same NEPA process to ensure that all impacts of a project are considered in the federal decision. |
| Independent utility | The opposite of a connected action, projects with independent utility are not connected to, dependent on, or depended on by any other action or projects, and thus, they can be examined in a separate NEPA process. |
| Segmentation | Segmentation occurs when connected actions are not incorporated into the appropriate NEPA process, and thus, the totality of the impact of a project is not considered in a federal decision. This is not permitted under NEPA, and it poses a risk of litigation. |
| Ripe for decision |
Projects are “ripe for decision” when
|
| Pre-decision and predetermination | Pre-decision involves taking an action to implement a project before NEPA has been completed (e.g., final design, acquiring land). Federal agencies cannot legally take such actions, and others who do so do it at risk. |
or no impacts to be evaluated, and (b) it is internal to the federal agency, thus it does not require information and review periods to be provided to the public or other agencies. The timeline for the process as set by law is 1 year for an EA, and for an EIS it is 2 years. Table 31 reviews some important terms that need to be understood when following the NEPA process.
When thinking about connected actions compared to independent utilities, consider whether a project would take place on its own, regardless of whether another project went through. Is there any benefit even if other actions are not taken?
For example, consider an air-rail connecting station where moving a parking garage to make way for the station could be considered a connected action or an independent utility. Would the parking garage be moved if the rail station were not built? Are there other benefits to moving the parking garage independent of building a rail station with terminal connection? If there is no benefit to moving the parking garage independent of building a rail station with terminal connection, then moving the parking garage is a connected action and must be examined within the rail station NEPA process.
Impact on Communities
Air Quality
Ground transportation is a major source of air pollution, particularly in urban areas with a high concentration of vehicles and poor air circulation. Additionally, congestion may pose greater risks to commuters and residents alike who are on or near arterial roads compared to freeways. This may be due to the lower travel speeds of the vehicles on arterial roads, leading to less vehicle-induced dispersion (Zhang and Batterman 2013). The emission of pollutants such as CO, PM, and NOx contribute to air pollution and associated health issues, as outlined in Table 32. The use of fossil fuels in vehicles is the main source of these emissions, and repeated, chronic exposure can lead to an increase in long-term health effects. This is important for airport access roadways with frequent congestion and high vehicular traffic, especially for residents living near the airport access roadways and frequent commuters (e.g., employees).
Table 32. Impact of Air Pollutants on the Environment
| Pollutant | Source | Impact on Humans | Impact on Vegetation | Impact on Climate | Impact on Materials |
|---|---|---|---|---|---|
| Carbon monoxide (CO) | Incomplete combustion | CO poisoning (oxygen starvation to circulatory and nervous systems) | N/A | Indirectly adds to the abundance of GHGs | N/A |
| Hydrocarbons (HC), including methane, isopentane, pentane, and toluene | Incomplete combustion; carburetion | Asphyxiation; aspiration; some are carcinogenic | Reduces plant transpiration rates | Methane has high greenhouse potential, leads to ozone formation | N/A |
| Nitrogen oxides (NOx) | Oxidation of N2 and N-compounds in fuels | Respiratory irritation and other problems | Acidification of soil and water; overfertilizing | NO2 has high greenhouse potential, leads to ozone formation | Weathering; erosion |
| Particulatesa | Incomplete combustion; road dust | Respiratory damage; various toxic contents | Reduced assimilation | N/A | Dirt |
| Soot (diesel) | Incomplete combustion | Carcinogenic | N/A | N/A | Dirt |
Source: Organization for Economic Cooperation and Development (1998)
Note: N/A = not available.
a Particulate health impacts are not equal among the varyingly sized particulates. Fine particulate air pollution (PM2.5) has been estimated to be responsible for approximately 95 percent of the global public health impacts from air pollution. While PM2.5 is not the only air pollutant that adversely affects health, it has significant negative health impacts.
While we know sources of air pollution, it is difficult to quantify the health impacts of poor air quality at granular scales. Observations on air quality for regulatory purposes are typically analyzed at broader local contexts, such as at ∼7.5 miles (12 kilometers), at ∼22 miles (36 kilometers), and at the county level. However, those scales limit the ability to examine relationships between population and health susceptibility, “both of which can spatially vary substantively within a city at smaller scales” (Kheirbek et al. 2016). This is applicable to the airport setting since the pollution generated from an airport via access roadways may be missed in a larger analysis, or it may be difficult to ascertain an airport’s effects using a broader study of air quality.
A 2021 study on air quality impacts deduced that disparities in health impacts associated with air quality vary more by race and ethnicity than by income, with a range difference in average exposure 2.4 times higher between people of color (POCs) and whites than the range in average exposure for POCs among income levels (Tessum et al. 2021). Even as overall exposure has decreased, a legacy of racist housing policy and other factors have caused racial and ethnic disparities to persist. Industrial, light-duty gasoline, construction, and heavy-duty diesel vehicles are often among the largest sources of disparity (Tessum et al. 2021).
The following items are potential actions to document and improve air quality issues that may arise from airport access roads as well as provide a more equitable resolution for those harmed:
- Perform a localized air quality study to determine emissions resulting from airport access roadways and their sources (e.g., industrial, light-duty gasoline, construction, heavy-duty diesel, and passenger vehicles).
- Engage with the surrounding community to determine perceived air quality issues from residents.
- Study airport access roadway improvements during the master planning process to determine whether roadway capacity needs to be increased, roadway efficiencies need to be introduced, or measures need to be taken to reduce negative air quality impacts.
- Strategize to develop a multimodal concept, and plan for the airport to reduce vehicular traffic to the airport.
Noise Pollution
Transit noise is described as using the “source-path-receiver” concept (Federal Transit Administration 2006). The source produces noise at varying decibel (dB) levels, depending on the type of source (e.g., transportation mode) and how it operates (e.g., speed). The “receiver” is the noise-sensitive land use that is exposed to noise from the source, such as a community close to the airport. The “path” is the area between the source and the receiver, where geography, intervening structures, and distance all help to minimize noise. At the receiver, the effects of environmental noise are evaluated. Because not all receivers have the same sensitivity to noise, different types of receivers have different noise requirements.
Noise Metrics
Analysts primarily employ the equivalent sound level (Leq), day-night sound level (Ldn), and sound exposure level (SEL) noise metrics to evaluate the noise implications of traffic and transit projects. The metric used varies depending on what impact needs to be measured (California High-Speed Rail Authority 2022a).
- Leq: The equivalent sound level is a measure of the average sound level over a period of time, including the variations of sound levels during that period. The peak hour of this sound measure is utilized for all traffic and light rail–noise evaluations at daytime facilities, including schools and libraries.
- Ldn: This metric is used to assess the impact of noise on people, considering both the level of noise and time of day. It is defined as the average sound level over a 24-hour period, with a 10-dB correction applied to sound levels occurring between 10 p.m. and 7 a.m. to account for the sensitivity to noise at night. It is the main noise-level descriptor for rail noise in residential land uses.
- SEL: The sound exposure level is the amount of sound energy exposed to a person over a certain period of time. Leq and Ldn are both calculated using SEL as an intermediate value.
- Weighted sound pressure level (Lmax): This metric is used to assess the highest sound level during a single noise event when the sound level varies over time, such as a passing vehicle. Lmax is commonly used in local and state ordinances for noise from private land uses and to assess the impact of construction.
Noise Sources
Noise pollution from airport ground access modes is a growing concern for communities located near airports. As the demand for air travel increases, airports are seeing a significant increase in the number of passengers and associated ground transportation. Traffic is a major source of noise, particularly in areas where there is a substantial number of road vehicles as well as railway vehicles in use. In addition to being unpleasant, noise contributes to health problems such as stress, sleep disturbances, cardiovascular disease, and hearing loss. Understanding the different sources of ground transportation noise and their unique characteristics is essential to develop effective strategies for reducing the noise and its impacts, especially to diverse lower-income communities surrounding the airports. The main sources of vehicular noise are as follows (Sinha and Labi 2007):
- Vehicle/air interaction: This noise is generated from the friction between vehicle body and air as the vehicle moves through the air. This type of noise is particularly noticeable at higher speeds and can have a significant impact in urban areas.
- Tire/pavement (rail wheels/track): This type of noise is generated by the tire thread blocks and vibrations as tires roll over the road. Typically, this noise is more noticeable on concrete pavements than on asphalt pavements. In rail transportation, noise is often produced by friction between steel wheels and the tracks, especially in curve sections.
- Vehicle engines: This type of noise is the primary source of noise from ground transportation at airports. It is the result of excessive noise emitted from the internal combustion process in engines. As these vehicles idle in airport parking lots and approaches to terminals, they create a significant amount of noise, which can also be amplified by the echo effect of buildings and other structures.
- Vehicle exhaust system: Vehicle exhaust systems increase noise levels, especially when noise-control equipment (i.e., mufflers) is not working properly. Exhaust noise levels closely resemble those of engine noise, and they are correlated with increased speeds, frequent speed changes, and bigger cars.
- Vehicle horns: Urban traffic noise may be significantly and gratingly increased by vehicle horns, especially in traffic cultures where frequent horn blowing is customary.
- Vehicle brakes: Brakes also generate noise due to high-pitched squealing or grinding sounds, especially for large vehicles.
Factors that influence the level of noise generated include
- Type and size of vehicles,
- Length of guideway exposed to the receiver,
- Nature of the traffic stream (speed, volume, etc.),
- Distance between noise source and receiver, and
- Existence and nature of any shielding features between noise source and receiver.
Waterway transportation is also being recognized as a potential threat to many marine animals due to the underwater noise that this mode generates (Veirs et al. 2016). Boats generate sound levels that range from fewer than 80 A-weighted decibels (dBA) to approximately 110 dBA for larger ones, at frequency levels ranging from 100 hertz to 100,000 hertz. These sounds are 20 to 30 dBA higher than deep ocean ambient noise, which can disrupt the ultrasounds emitted by orcas when locating their prey.
The federal regulations on motorboat noises as per 36 CFR § 3.15 are
- A person may not operate a vessel at a noise level exceeding:
- 75 dBA measured utilizing test procedures applicable to vessels underway (Society of Automotive Engineers SAE - J1970); or
- 88 dBA measured utilizing test procedures applicable to stationary vessels (Society of Automotive Engineers SAE - J2005).
State regulations vary between states; however, some states have adopted the federal regulations.
Noise Impact Criteria
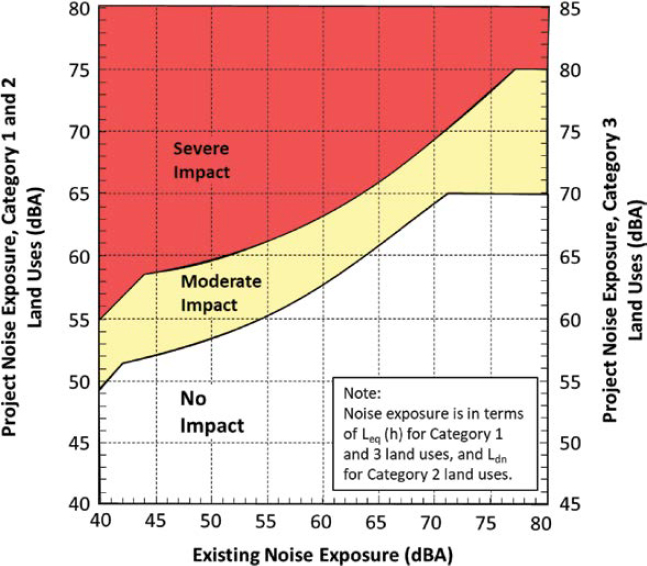
The parameters for measuring noise impact are based on a comparison of existing and anticipated outdoor noise levels of the airport ground access mode under consideration. They consider both absolute criteria and relative criteria. Absolute criteria consider activity interference brought on by the transit project alone. Relative criteria consider the discomfort brought on by the transit project’s change in the noisy environment. The noise criteria and descriptors are determined by land use, as shown in Table 33.
The FTA has established noise impact criteria levels that consider existing noise levels and the projected noise increase due to the transit project. The level of impact ranges from no impact to severe impact, as depicted in Figure 80 and the following list:
- No impact: Transit-generated noise is not likely to cause community annoyance. Noise projections in this range are considered acceptable by the FTA, and mitigation is not required.
Table 33. Land Use Categories
| Land Use Category | Land Use Type | Noise Metric (dBA) | Description |
|---|---|---|---|
| 1 | High sensitivity | Outdoor Leq(h)a | Tracts of land where quiet is an essential element in their intended purpose. This category includes lands set aside for serenity and quiet, like outdoor amphitheaters, concert pavilions or halls, recording studios, and National Historic Landmarks with significant outdoor use. |
| 2 | Residential | Outdoor Ldn | Residences and buildings where people normally sleep. This category includes homes, hospitals, and hotels, where a nighttime sensitivity to noise is assumed to be of utmost importance. |
| 3 | Industrial | Outdoor Leq(h)a | Institutional land uses with primarily daytime and evening use. This category includes schools, libraries, theaters, and churches where it is important to avoid interference with activities like speech, meditation, and concentration on reading material. Places for meditation or study associated with cemeteries, monuments, museums, campgrounds, and recreational facilities can also be considered in this category. Certain historical sites and parks are also included. |
Source: FTA (2006)
a Leq for the noisiest hour of transit-related activity during hours of noise sensitivity.
Source: FTA (2006)
- Moderate impact: Project-generated noise in this range is considered to cause impact at the threshold of measurable annoyance. Moderate impacts serve as an alert to project planners for potential adverse impacts and complaints from the community. Mitigation should be considered at this level of impact based on project specifics and details concerning the affected properties.
- Severe impact: Project-generated noise in this range is likely to cause a high level of community annoyance. The project sponsor should first evaluate alternative locations or alignments to determine whether it is feasible to avoid severe impacts altogether. In densely populated urban areas, evaluation of alternative locations may reveal a trade-off of affected groups, particularly for surface rail alignments. If it is not practical to avoid severe impacts by changing the location of the project, mitigation measures must be considered.
Depending on the proposed or existing ground access modes at an airport, a noise assessment should be completed for each proposed or existing mode to determine which would have less impact on the airport and the communities.
To minimize the impact of transportation noise, it is important to consider effective measures and strategies to reduce the level of noise generated by these systems. Examples of mitigation measures include
- Implementing noise-reducing technologies in vehicles, such as quieter engines and tires;
- Implementing operational procedures that minimize noise, such as restricting engine idling and using designated noise-free parking areas for vehicles;
- Designing infrastructure to reduce noise exposure, such as building sound barriers and using soundproofing materials in buildings;
- Promoting quieter alternatives for transportation;
- Reducing tire noise with open-graded asphalt pavement material; and
- Enforcing sufficient right-of-way distances.
Light Pollution
Airports are significant users of artificial light; they illuminate local nights, which contributes to light pollution (Land Over Landings 2019). Light pollution is an undesirable byproduct of outdoor illumination caused by inefficient lamps and luminaires or other excessive amounts of brightness at night (McColgan 2004). Light pollution can take the form of glare, sky glow, light trespass, or clutter, which can negatively affect human health and the environment:
- Glare: This occurs when there is a bright light that causes visual discomfort or impairs vision.
- Sky glow: This refers to the brightening of the night sky caused by the collective glow of all artificial lights. Sky glow makes it difficult to observe stars and other celestial objects, and it can also interfere with the natural cycle of plants and animals.
- Light trespass: This occurs when artificial light spills over into areas where it is not intended or needed.
- Clutter: This refers to an excessive or confusing display of lights.
Road
The illumination of highways and streets, coupled with car lights, is one of the most significant sources of light energy emitted into the environment. Light pollution from airport ground access roadways can impact wildlife, as well as residents and drivers alike (Electric Power Research Institute and Lighting Research Institute 2000):
- Residents: Light that crosses a residential property border may be considered undesirable. Unwanted light entering a home through windows, such as those in bedrooms, is a concern that is frequently brought up. Direct viewing of bright light sources is usually uncomfortable, especially in areas where a low level of ambient light is preferred.
- Drivers: Bright light sources may seriously affect a driver’s visibility because of disability glare. In addition, visual confusion created by extraneous light sources can affect a driver’s ability to locate and recognize signal lights.
Vehicles
Road vehicle headlights have generally seen a steady rise of light emissions due to technological advancements. Currently, the maximum intensity permitted along the axis of a single headlamp in high beam is 75,000 candelas in the United States (National Highway Traffic Safety Administration 2018). High-intensity discharge xenon, light-emitting diodes (LEDs), and—in very limited fashion—laser light sources are replacing halogen bulbs as a result of recent technology advancements, all of which may achieve larger visible outputs (Gaston and Holt 2018). There is no indication that headlight technology advancements will prevent emissions from rising in the future, unless road vehicle technology develops to a point where headlights are rendered unnecessary.
Emissions from headlights are typically pulsed due to the passage of vehicles. The pattern of the pulse is determined by vehicle speed, traffic volume, and time of day. The shorter the pulse of light received at a spot along the roadside, the faster the vehicles are going, and vice versa. Airport access roads tend to be areas with slower-moving vehicles and higher traffic volumes, which results in longer headlight displays.
Reducing headlight pollution mainly depends on vehicle manufacturers utilizing warmer-colored bulbs and drivers using high beams only when there is no approaching traffic in dark regions. The airport can minimize the impact of headlight pollution to the surrounding residents by erecting structures, such as walls, that prevent light trespassing.
Infrastructure
The design of safe roads must include adequate illumination for the roads. However, light from streetlights can trespass onto private property or natural areas, and light can be directed upward directly from existing light fixtures or reflect off the road surface, all of which contribute to sky glow.
Streetlight technology has undergone a change similar to road lights, which has sparked intense public debate about the consequences for human health and wellness, aesthetics, and broader environmental effects. Particularly, the deployment of LED street lighting with higher correlated color temperature values has faced popular criticism in some locations (Gaston and Holt 2018).
Reduction of light pollution among road infrastructure can be achieved through various methods, with two prominent ones being the type of light and placement and an adaptive lighting system:
- Light type and placement: Light pollution among airport ground access can be reduced by using LED lighting fixtures that are designed to direct light downward and away from light-sensitive areas, such as neighboring communities. Ensure that the lighting fixtures are properly shielded to reduce glare and light trespassing.
- Adaptive lighting: This is an intelligent lighting system that uses sensors and other detection devices to adjust the brightness of road lighting based on the presence or absence of vehicles, pedestrians, and weather (Federal Highway Administration 2014).
By implementing these two methods, road lighting pollution can be reduced while still maintaining adequate levels of safety and security. These solutions also offer added benefits of reducing energy consumption, resulting in a more sustainable and environmentally friendly approach to road lighting.
Rail
Similar to roads, light pollution from rail may come from the trains or infrastructure. Infrastructure lights include lighting fixtures attached to rail poles and span wires above the
rails. These are typically used to provide illumination for trains, stations, and surrounding areas. These lights often create light pollution if not properly designed, directed, and shielded. A recent innovation developed in the Netherlands involves rail lights being installed on the sides of rail tracks instead of on poles to reduce light pollution as well as energy consumption (Organic Lighting 2022).
Currently, the railway industry has little to no regulation of light pollution. For an airport with rail connections or the potential to add rail connections, collaboration with the Federal Railroad Administration should be initiated to discuss the possibility of implementing new tools and procedures that may reduce light pollution and its harm on communities. Collaboration with the Federal Railroad Administration will be required until new regulations have been tested and approved by the agency that decrease community harm and disturbance (National League of Cities 2022).
Reducing Airport Light Pollution
Reducing light pollution is one way to incorporate sustainability at an airport. Sustainability activities that reduce airport light pollution can encourage effective nighttime lighting control by examining methods for reducing airport light pollution through design and planning best practices. Examples of these efforts include lighting plans, motion sensors, timers, siting and design standards, light-level evaluations, and light shielding. The results of these efforts lower resource consumption and improve living conditions in neighboring residential areas. These activities consider all artificial lighting on an airport that could be deemed excessive, inappropriate, or obstructive within the airport site, including road and sidewalk lamps and parking structure lighting.
Such activities can earn airports sustainability awards or credits. An example of a sustainability credit is the Leadership in Energy and Environmental Design (LEED) SS Credit 8—also known as the Light Pollution Reduction credit—under the LEED rating system for sustainable infrastructure. This credit has the intent to “minimize light trespass from the building and site, reduce sky glow to increase night sky access, improve nighttime visibility through glare reduction, and reduce development impact on nocturnal environments” (U.S. Green Building Council 2023). This credit is worth one point toward LEED certification.
According to ACRP Report 119: Prototype Airport Sustainability Rating System—Characteristics, Viability, and Implementation Options (Lurie et al. 2014), light pollution, specifically at airports, can be reduced in a variety of ways, such as
- Modeling the site lighting to establish a baseline level and evaluate benefits;
- Adopting strict site lighting criteria to maintain appropriate light levels while avoiding off-site lighting and night sky pollution, adjusted for seasonal daylight fluctuations;
- Limiting lighting in protected ecological areas to mitigate lighting impacts on wildlife;
- Focusing light on the ground and using full cutoff luminaires as well as low-reflectance, non-specular surfaces and low-angle spotlights for roadway and building lighting to limit night sky pollution; and
- Developing greenbelts along the airport perimeter as an attractive light and noise buffer between the airport and the community.
Community Engagement
Community engagement and outreach is an important factor in the planning and design process for new transportation modes or improvements to an existing mode. Communities both impact and are impacted by transportation networks, and the main goal of community
engagement is to ensure that the concerns, issues, and needs of the local residents and stakeholders are considered. The following are examples of community concerns about transportation projects:
- Environmental impact: Community members may be concerned about environment habitat destruction; air, water, and noise pollution; and other related impacts.
- Traffic congestion: While a transportation project may aim to improve traffic flow, it can also cause temporary or long-term traffic congestion during construction and, in some cases, after completion. This may impact local businesses and the quality of life for residents.
- Safety and security: There may be concerns about (1) the safety measures in place for new or improved transportation modifications, and (2) the security plan and how it enables the transportation mode to prevent, manage, and respond to threats. Some examples of these safety and security concerns are the potential for accidents and increased crime in areas where transportation infrastructure is being built (Zhang et al. 2020).
- Property values: Transportation projects can affect land use and development patterns in a community. For example, new transit systems may spur development in certain areas while discouraging development in others. There may be concerns that a project will negatively impact housing affordability and the value of property in the area.
- Access: If one group is allowed to experience the negative impacts of transportation projects without having access to the services that the transportation projects offer, and if there is no transparency in the planning process and early engagement, there may be questions or concerns about the dispersion of impacts within the community. Early and consistent engagement with different groups and the incorporation of their input throughout the project will generate community and stakeholder buy-in.
- System management: There may be concerns about the performance and cost of the transportation mode (reliability of the service, average trip travel time, length of delays, etc.).
- Historic preservation: There may be concerns if the transportation project would impact historical buildings or buildings with unique features.
- Aesthetic concerns: There may be concerns that a new transportation mode or improvements to an existing line will disrupt the visual appeal of an area.
Areas of Improvement and Considerations
The most common tenet of community engagement is that the public and other stakeholders be identified and engaged with early and often, as it “can also help avoid costly re-work and delays later in the project lifecycle, including potential litigation or complaints from community members” (U.S. Department of Transportation 2022b). However, public involvement is often treated like a public hearing or informational session rather than a process to be incorporated into planning, design, and decision-making. The preference or tendency toward information sharing can introduce barriers to public participation as well as lead to suboptimal outcomes and
troubling practices [like] unveiling plans and projects too late in the process to influence the definition of the project’s purpose and need or the development of alternatives; framing outreach narrowly so as to limit sincere consideration of expressed community needs and preferences toward particular alternatives or concerns; confining involvement processes to taking comments at a public hearing; scheduling events at inconvenient times or difficult-to-reach locations for segments of the affected community; and narrowly defining “success” as securing the “buy-in” from local elected officials whether or not there is support from locally affected communities. (Aimen and Morris 2012)
The U.S. DOT states that “achieving meaningful public involvement requires the creation and implementation of equitable programs and plans using a diverse and inclusive range of communications and outreach tools and methods throughout the project or program lifecycle” (U.S. Department of Transportation 2022b). This meaningful public involvement process is only achievable if the appropriate means and methods are utilized for the specific affected community to solicit accurate responses and the community’s input is considered. The process will need to
recognize that engagement is not the same for all communities. Thorough engagement is flexible and can be adjusted based on the community and circumstances to elicit a meaningful response.
Infrastructure related to many of the modes of airport ground access identified in Chapter 8 would extend beyond airport property. The planning process should involve obtaining input from the community, airport workforce, passengers, and other local stakeholders on their transportation needs. Meaningful community engagement processes require planners to take a more holistic approach and identify how a project may meet not only the objectives of the planning agency but also the objectives of the communities where proposed modes will be situated. Planners should consider the following questions very early on in the planning process:
- Who are the communities surrounding the airport, and what are their unique needs and challenges?
- Have any prior transportation planning decisions caused harm to communities?
- Does each community trust that the airport has their best interests in mind, and how can a relationship be sustained to build trust?
- Who requires improved access to the airport, and who are the ground access systems intended to serve?
- Will the ground access modes meet the needs of the communities they are being proposed in?
- Were communities invited to participate in the planning process before the project details were finalized?
- Do communities have a voice in the decision-making process and the ability to influence planning outcomes? What does the engagement process entail?
- Are ground access modes or technologies contained to the airport property, or are they integrated into community transportation systems?
- Will not only the airport but also the communities benefit from the planned infrastructure project?
There are several barriers that can prevent communities from participating in the community engagement process for transportation projects (U.S. Department of Transportation 2022b), especially among communities with poverty and low income, as well as persons with disabilities. These barriers include
- Lack of awareness: Many community members may not be aware of upcoming transportation projects or community engagement opportunities, especially if they live in underserved areas or have limited access to information and resources.
- Language barriers: Language barriers can make it difficult for non-native English speakers to understand information provided by the transportation agencies or participate in community engagement activities.
- Time constraints: Community members may have limited time available to participate in the community engagement process due to work, family obligations, or other responsibilities. Transportation agencies may need to consider alternative engagement methods that are more flexible and accessible, such as online surveys or virtual meetings.
- Transportation and access barriers: Community members who lack access to transportation or who have mobility challenges may face barriers to attending in-person meetings or events. Transportation agencies should consider providing transportation services or hosting events in accessible locations to ensure that all community members have an opportunity to participate.
- Trust and perception: Some communities may feel that their input is not valued or that their concerns may not be taken seriously by transportation agencies. Building trust with communities and creating a welcoming and inclusive environment can help to address these concerns and encourage greater participation in the community engagement process.
- Access to information: Innovative methods of disseminating information can disenfranchise those who may not have the technology to receive information relayed via limited electronic methods, especially older adults and those who do not have the financial ability to afford such devices.
Other intangible barriers also exist that airports must overcome to obtain meaningful community engagement, such as
- Internal thought processes (e.g., “we’ve always done it this way”);
- Reliance on one-size-fits-all methods; and
- Lack of organizational accountability.
The effects of these barriers can be felt by community members and participants, reflected as a criticism of transit communication. One criticism is that strategic communication effects are not routinely evaluated against clear metrics for success but rather to “come to general conclusions about whether they reached out to a large enough, or targeted enough, audience” (Forinash 2020).
Rather than focusing on a targeted or wide enough audience, setting clear and measurable goals for communicating with communities can yield more successful community engagement. Knowing a community and the best methods for receiving and delivering information are key to effective public engagement. Similarly, communication and transparency are particularly vital in disadvantaged communities due to a lack of trust in the government as well as a lack of awareness among the general public of the community benefits of transit improvement projects (Forinash 2020).
Public Participation
In October 2022, U.S. DOT released guidance in Promising Practices for Meaningful Public Involvement in Transportation Decision-Making that provides resources for transportation planners to employ meaningful public involvement practices in decision-making processes. According to the guidance material, meaningful public involvement is defined “as a process that proactively seeks full representation from the community, considers public comments and feedback, and incorporates that feedback into a project, program, or plan when possible” (U.S. Department of Transportation 2022b). The document provides a framework for creating a meaningful public involvement plan and building organizational capacity to support and institutionalize best practices. It describes the features of meaningful public involvement as
- Understanding community demographics,
- Building durable community relationships,
- Understanding community wants and needs,
- Involving broad representation of community,
- Using community-preferred engagement techniques, and
- Documenting and sharing the community’s impact on decisions.
For other transportation modes that have planned and designed projects, additional communication and engagement with the community is warranted to broaden the community input that can be received. TCRP Research Report 208: Strategic Communications to Improve Support for Transit-Priority Projects: Report and Toolkit (Forinash 2020) stated that the following strategic communication practices are more likely to lead to successful project outcomes:
- Identify key stakeholders early in the project planning process.
- Develop a coordinated strategic communication plan that targets stakeholder groups.
- Commit to strategic communications throughout a project life cycle, particularly through the direct dedication of staff and resources to communication efforts.
- Adapt communication practices according to audience contexts and observed efficacy.
- Meaningfully engage with key stakeholder groups, often in hyperlocal contexts.
Developing a public involvement plan involves building trust and meeting community members where they are. As many underserved populations have historically been excluded from
transportation decision-making processes, they are often distrustful of the institutions whose planning decisions have led to the harms and negative outcomes that they observe in their communities. Individuals may feel that, even if they do participate in engagement efforts, their voice will not be heard or have any influence on planning outcomes.
Airports should design engagement processes that center community voices and use input from communities to design infrastructure in their neighborhoods that meet their transportation and mobility needs. Planning processes should consider the lived experiences of community members and their local knowledge. Outreach approaches should be tailored to the communities that planners seek to obtain input from. Instead of making assumptions about the community’s preferred communication methods and convenient meeting locations and times, planning agencies need to identify the communities from which they seek input and conduct targeted engagement to get their feedback on what engagement options are preferred. To sustain engagement over time, build trust, and obtain improved outcomes, airports could consider partnering with community organizations and stakeholders through advisory committees or working groups that facilitate consistent information sharing and collaboration (Twaddell and Zgoda 2020).
It is often difficult for populations not traditionally involved in decision-making processes to devote time to participate in lengthy meetings when they are juggling other priorities. Airports and planning agencies should consider removing barriers to involvement by exploring the feasibility of compensating community members for their time and input given to planning processes. Other considerations to improve accessibility are to provide childcare and offer food during meetings that take place at mealtimes (Georgetown Climate Center 2018).
Community Engagement Strategies
A variety of communication media should be used in a successful community engagement strategy, and determining the best communication medium to use depends on the goal of the specific outreach effort. According to Aimen and Morris (2012), there are contextual attributes that are likely to affect the
approach to interactions with the affected public and traditionally underserved populations, including
- Geographic scale of the transportation activity or decision;
- Public or community attitude toward the agency and its history and treatment;
- Understanding of the subject activities and the degree of controversy they engender;
- Cultural, social, and economic composition of the populations affected;
- Nature of input needed or sought;
- Timeline for decision; and
- Level of public involvement and type of engagement or collaboration desired by the agency.
A case study analysis conducted for TCRP Research Report 208 (Forinash 2020) determined the following effectiveness for various communication media:
- Outreach that is conducted in person and on the ground appears to be more effective at addressing stakeholder concerns than online outreach.
- Online and postal communication media are effective at providing project information to a wide audience.
- The efficacy of social media is questionable.
- Outreach consultants are useful in the development of communication content and implementing outreach in the field, but they are not necessarily important in strategic communication planning.
Since there are multiple different contexts that affect the selected approach, “there is no ‘one-size-fits-all’ approach or defined series of steps or processes that must or should be followed” (Aimen and Morris 2012). Rather than a prescribed community engagement approach, there
are seven nonsequential, and often interrelated, task objectives outlined by NCHRP Report 710: PracticalApproaches for Involving Traditionally UnderservedPopulations in Transportation Decisionmaking (Aimen and Morris 2012):
- Identify populations. Understand who is likely to be affected by transportation decisions and thus should be included in the decision-making process, per the International Association of Public Participation’s core values of public participation.
- Implement public involvement plan. Implement a procedural guide that describes effective strategies for encouraging public participation. This is particularly relevant for statewide and metropolitan planning, project development, and environmental review stages in decision-making, though it should be used to guide all stages of the decision-making process.
- Provide information. Advertise events and describe the activities of the airport and relevant transportation agencies engaged in landside operations so that coming changes or potential impacts are clearly conveyed.
- Gather feedback. Use a variety of strategies (website, survey, informal or formal events, etc.) to gather feedback from a wide audience. Consider accessibility challenges to make participation accessible and available to all.
- Build relationships. Form relationships with the community before, during, and after the decision-making process using tools like advisory boards, committees, and community organizations.
- Deliver benefits and mitigate impacts. Deliver benefits agreed on between the community and the airport, and mitigate impacts to the community and resources per NEPA.
- Overcome institutional barriers. Tackle root causes for why some populations are consistently underserved through an array of methods, such as mentoring, training, and community employment programs.
Improving Outcomes
Incorporating emerging transportation and ground access technologies at airports presents an opportunity to improve outcomes and connections to resources, jobs, and services for underserved communities. Planners should consider community outcomes related to safety and well-being, affordability, mobility and connectivity, and accessibility when weighing development of various airport ground access technologies and modes of transportation.
Safety and Well-Being
Ensuring the safety and security of populations not traditionally involved in decision-making processes should be a focus when planning for integration of emerging technologies and ground access infrastructure at airports. These populations may face unsafe conditions associated with deteriorating infrastructure, historic lack of investment, and lack of access to different transportation modes. Shifting the focus away from car-centric planning to multimodal planning presents an opportunity to ensure that basic infrastructure—such as streets, sidewalks, and bike lanes—is safe, accessible, and well-maintained for all users. Low-cost, active transportation options—such as walking, biking, and transit—are not feasible if people do not feel safe within the infrastructure systems where these modes are offered. Increasing the safety and availability of active transportation options also provides additional health benefits gained from physical activity, such as the potential for reduced risk of chronic diseases like diabetes and obesity.
Affordability
Planning for affordable multimodal transportation options for populations not traditionally involved in decision-making processes should be a focus of infrastructure investments. Some of
these populations do not own a car and rely on public transportation options to reach critical services, employment, school, and other destinations. For households in the United States, transportation is the second highest expenditure category after housing expenses. Affordability of transportation options refers to costs relative to incomes, and people with lower incomes spend a greater proportion of their income on transportation (U.S. Department of Transportation 2022a).
Mobility and Connectivity
Mobility and connectivity between transportation modes and destinations are needed for underserved populations to access essential places, services, and opportunities. To plan effectively, agencies can consider how mobility and connectivity can be improved through transportation offerings and how siting of infrastructure impacts and serves existing populations.
Shared mobility is an example of an emerging technology that could improve options for underserved populations. Shared mobility is defined by FHWA as the shared use of a motor vehicle, bicycle, or other low-speed transportation mode that allows users to obtain short-term access to transportation, as needed. Shared mobility, or micromobility, allows for low-cost connections to public transit for the first and last miles (FLM), can fill gaps in transit service, and enables individuals without access to a private vehicle to access essential destinations. Technologies such as ridesharing can provide mobility for people with physical, sensory, and cognitive disabilities if the vehicles are accessible to these individuals. For low-income and older adults, one barrier associated with these technologies is that they require smartphone access and credit or debit card access (Shaheen et al. 2017).
Accessibility
Airport ground access infrastructure should consider the accessibility needs of aging people, persons with differing abilities, and persons with Limited English Proficiency in compliance with Title VI of the 1964 Civil Rights Act. Ensuring smooth connections between transportation modes and improving reliability of transportation systems for users with disabilities presents an opportunity for improving equity when planning for integration of new ground access technologies at airports. Planners should engage with accessibility and disability advocates throughout the planning process to obtain their input on technology, infrastructure, and design considerations. Van Horn et al. (2020) provide additional resources for understanding the needs of these passengers and the challenges that they face when navigating through an airport environment.
U.S. DOT is strategically focused on improving the transportation system for people with disabilities by removing barriers for people with disabilities to operate and ride in emerging transportation technologies, removing barriers to the multimodal accessibility of public rights-of-way, and improving opportunities for people with disabilities to use micromobility services and other technologies (U.S. Department of Transportation 2021). Airport planners could consider similar goals when improving the accessibility of ground access at airports. AVs are an example of an emerging technology that could improve options for populations that are not traditionally involved in decision-making processes. AVs could enable people with physical, sensory, or cognitive disabilities or people who are otherwise unable to obtain a driver’s license to travel independently and spontaneously to access jobs, food, healthcare, and other essential destinations (U.S. Department of Transportation 2020a).
Resources
There are many resources available for planners to incorporate fairness to all into decision-making and planning processes. Table 34 provides a sampling of resources, categorized by ground access mode.
Table 34. Resources by Mode
| Ground Access Mode | Examples | Resources to Inform Planning Processes |
|---|---|---|
| Micromobility | Public transit, bikeshare, ride-hailing, electric scooters, microtransit, moving walkways/people movers |
|
| Transit/Bus | Scheduled bus and shuttle services, BRT |
|
| Transit/Rail | PRT, mass rapid transit (MRT), light rail technology, commuter and regional rail, intercity and high-speed trains |
|
| Other | Aerial cableway technology, waterway transportation |
|
| Emerging | CAVs |
|
| AAM, vactrains |
|
Homeless and Unhoused Communities in Mass Transit
Shelter is a basic human need that many lack. According to the U.S. Department of Housing and Urban Development, 584,462 people experienced homelessness in January 2022. The limited capacity of shelters and other social service agencies to meet the needs of a rapidly growing unhoused population has forced individuals experiencing homelessness to find shelter in various public spaces, including transit vehicles, bus stops, and transit stations. Many of them also use transit to reach destinations such as workplaces, shelters, and community service centers. With affordable housing scarce in some metropolitan areas and the scale of the homelessness crisis often surpassing the capacities of existing safety nets, transit operators face these pressing issues by themselves and might have to implement policy measures beyond transportation in order to address them (Ding et al. 2022):
-
ACRP Research Report 254: Strategies to Address Homelessness at Airports (Fordham et al. 2023) provides a step-by-step process to address homelessness that varies depending on the airport:
- – Learning the fundamentals. Homelessness is a broad yet complex issue, and understanding the root causes helps with solving the issue. It is important for airports to build informed awareness, even when this issue is not an airport’s core mission.
- – Assessing current conditions. The current regional socioeconomic conditions vary depending on the airport and can be responded to with different resources. Airports can use existing data to assess the trends and create efforts that will empower airport stakeholders to make informed decisions.
- – Identifying and working with partners. Partnerships provide aid to this complex issue and are an effective way of giving people experiencing homelessness access to information, tools, and resources.
- – Planning a response. Depending on the scale of homelessness in a region, the nature of situations and incidents, partnerships, and funding available for the airport’s response to homelessness will be different. Having a response plan helps the airport identify specific actions and assign responsibility for the implementation.
- – Outlining staff and stakeholder responsibilities. Defining roles and responsibilities allows the airport’s response to be structured and clear, especially when different departments have to get involved (law enforcement officers, airport operations staff, etc.).
- – Developing and implementing a training program. Training helps airport staff provide aid and connect individuals with effective responses. Creating awareness among airport employees is essential for responding to this issue.
- – Developing an engagement protocol. Depending on the needs of each individual, there are different ways to engage with them. Airport staff should be able to refer to protocols best suited for the situation.
- – Tracking progress. To determine whether their efforts to address homelessness issues are working as intended, airports are encouraged to track progress of their programs, compare them with their program objectives, and consider how their programs can be sustained over time.
-
TCRP Synthesis 121: Transit Agency Practices in Interacting with People Who Are Homeless (Boyle 2016) suggests different approaches that have benefited the responses of the airports in different cases:
- – Consistent enforcement. This includes the enforcement of a code of conduct in order to provide a safe environment for the traveling public, as well as being consistent with the application and enforcement of these rules.
- – Partnerships with homelessness agencies and community leaders. These partnerships include social service agencies, local police departments, and cities. These organizations’ goals include aiding the unhoused and encouraging dialogue with cities or counties that have resources to address this issue.
-
- – Commit resources for outreach to people who are homeless. Because of the warmth and air conditioning typically provided by transportation systems, they becomes a de facto shelter to get warm in the winter and to cool down in the summer, causing these facilities to house many people experiencing homelessness. Dedicated outreach teams can aid in establishing relationships with clients, and this can help service-resistant users accept services.
- – Respect the humanity of individuals who are homeless. Treating everyone with respect allows staff to connect individuals with appropriate resources—customers get the message that they are not violent or unwanted, and thus they agree to receive help.
- – Training, hiring, and internal discussion. Staff who are close to the transit system should receive training to keep them aware of issues related to homelessness that could impact transit.
- – No free fares. The inclusion of fare policies such as low-income passes and reduced-price passes for social service agencies allows for equity in transit systems, but free fares have been identified as an exacerbator of potential issues.
According to a survey conducted by the UCLA Institute of Transportation Studies (Loukaitou-Sideris et al. 2020), most transit agencies (86 percent) partner with one or more organizations. Roughly 7 out of 10 transit authorities have partnered with local law enforcement, 6 out of 10 have partnered with public social service organizations, and about half of the surveyed participants have a partnership with a nonprofit organization or private foundation working on addressing homelessness.
In 2020, Chicago Transit Authority’s Blue Line at Chicago O’Hare International Airport (ORD) experienced a homelessness crisis. Therefore, this transit authority partnered with initiatives like the Haymarket Center Outreach Program, a nonprofit with an office along the Blue Line to connect people to social services, and other programs to aid unhoused persons who have been staying at the airport. Another strategy implemented at this airport by the Chicago Transit Authority is having Chicago police officers check for “proof of airport business,” either boarding passes or employee badges, to anyone arriving at the airport via the Blue Line between 10 p.m. and 4 a.m. CDT. At Washington Dulles International Airport (IAD), a group of airport staff, identified as Travelers Aid, connect persons experiencing homelessness to services tailored to individual needs. If Travelers Aid employees are concerned for a person’s well-being or if the situation escalates, IAD law enforcement is called for assistance (Fordham et al. 2023).


