The Future of Commuter Rail in North America (2025)
Chapter: 5 North American Case Studies
CHAPTER 5
North American Case Studies
To gain a deeper understanding of the institutional structures, funding arrangements, ridership trends, and opportunities, the research team conducted six thematic case studies of specific examples of how North American commuter railroads are preparing for their future. The case studies were selected based on their innovative practices or valuable lessons learned to the broader community, using input from the research team’s experience and the project panel. The team was also mindful of differences in terms of geography, operating patterns, and applicable lessons for other commuter railroads.
The report includes the following case studies:
- MBTA Commuter Rail: Timetable change and its effect on ridership
- Metra Commuter Rail: Implementing a new fare policy
- Caltrain: Electrification of commuter rail
- Metrolink: Overcoming funding and institutional barriers to making timetable changes
- Utah FrontRunner: Operational readiness for future schedule implementation
- CTDOT Commuter Rail: Developing strategies for transit-oriented development
For each case, the research team met with agency staff, reviewed public documents, and assessed data to bring out the lessons for other commuter rail providers in North America.
5.1 Timetable Change and Its Effect on Ridership: MBTA Commuter Rail
Changing from a traditional commuter rail operating pattern to an all-day bi-directional service can have significant effects on the ridership of a service. Most commuter railroads in North America typically prioritize service inbound to downtown stations during the morning commute and then back to the suburban stations in the evening. The emphasis on the weekday peak served a strong but limited market that has not completely recovered since 2020. However, by changing its timetables, MBTA Commuter Rail is demonstrating its ability to meet a much broader market.
MBTA Commuter Rail is a 12-line system of regional rail lines radiating from one of two terminal stations in Boston: North Station and South Station.41 The current network is the result of over 150 years of regional passenger rail service in the region and the public consolidation of several previously private lines. The system has 136 active stations and 394 route miles, with 107,000 average daily weekday riders (APTA 2024). Keolis Commuter Services operates the network under contract with MBTA.
The MBTA Commuter Rail system stands out as the only legacy commuter rail network currently operating above its pre-COVID ridership. Even though other legacy systems have
similar networks, land uses, and markets, they have still struggled to recapture the same ridership levels. Figure 13 shows how nine U.S. legacy commuter railroad systems steadily gained traffic until the summer of 2022, with SEPTA and the three New York City–area railroads (NJT, Long Island Rail Road, and Metro-North) plateauing around 70 percent of their 2019 ridership. Chicago’s Metra leveled off at around 55 percent, and Caltrain (Peninsula Corridor Joint Powers Board) and MARC (MTA) at 40 percent, although Caltrain saw a boost around May 2024. The exception is the MBTA Commuter Rail ridership, which continued to grow and is now on average close to 100 percent of what it was in 2019.
The success at MBTA Commuter Rail is rooted in several factors related to changes it made to its timetable during and following the COVID-19 pandemic, as well as factors related to operational performance, fare promotions, and land use.
Schedule Changes
Before the COVID-19 pandemic, most MBTA Commuter Rail lines had bi-directional service for most of the day but had irregular and limited schedules in off-peak directions, on the weekends, and during off-peak times.42 When COVID-19 struck and stay-at-home orders began, ridership dropped precipitously. MBTA told Keolis to retain all employees despite shifting
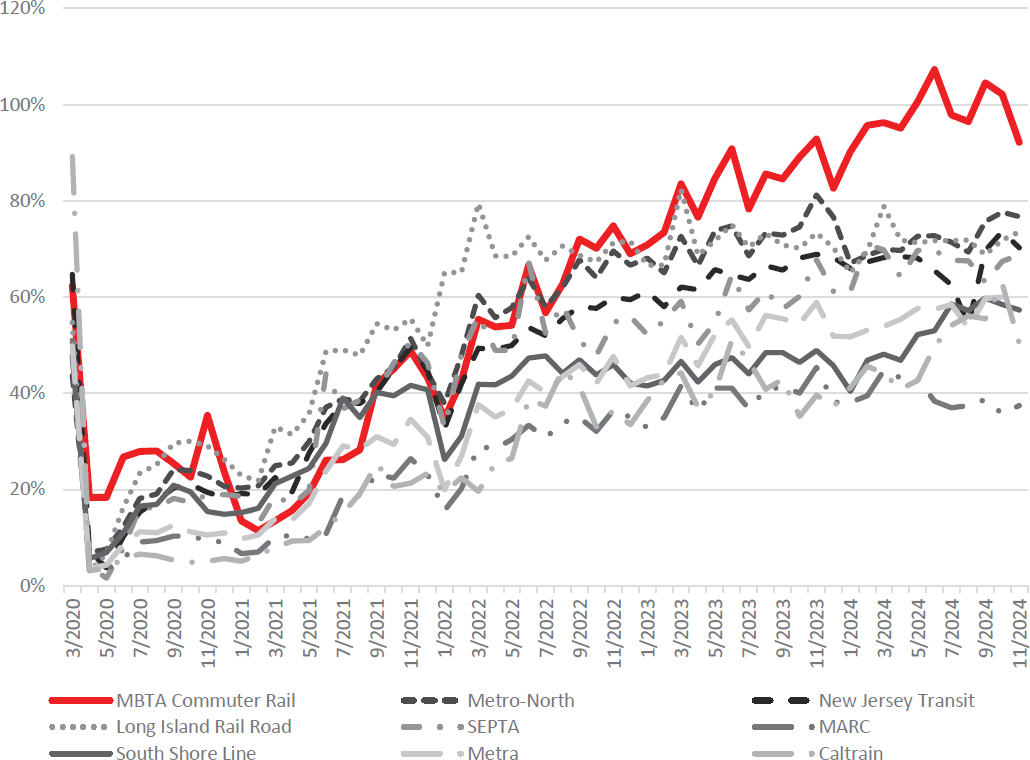
Figure 13. Legacy commuter railroad ridership, as a percentage of most recent pre-pandemic corresponding month (e.g., September 2024 compared with September 2019; February 2024 compared with February 2020).
schedules, and service was overhauled to support those that needed to travel, with a base bi-hourly schedule on all lines. This schedule also saved operating expenses. Then, in 2021, service was generally doubled, and the agency also identified ways to interline service instead of dedicating trains to a single route.
The current commuter rail schedule was built off the 2021 hourly service, with frequencies added as ridership continued to grow. With some exceptions, most lines operate as of the fall of 2024 on regular, repeating, all-day, bi-directional service with at least one train per hour per direction. When capacity is needed, peak-strengtheners are added. Most lines are all local service, with only one or two stopping patterns on each line.43
Except for significant added service on the weekends, the total daily commuter rail service levels are about the same as they were in 2019 but are more evenly distributed throughout the day (including longer gaps in the peak). For the entire network, vehicle revenue miles have increased 3 percent, and vehicle revenue hours have increased by 11 percent from 2019 levels.44 An exception is the Fairmount Line, which runs through a denser and lower-income part of the region, where service was expanded dramatically. Stations on the Fairmount Line received 34 daily trains in each direction in 2024, compared with only 20 in 2019.
MBTA also made a few additional changes to help bring back riders, including marketing campaigns and a $10 fare for unlimited weekend travel.45 The new schedules have also enabled better on-time performance. From 2016 to 2019, on-time performance was between 88 and 90 percent, measured within 5 minutes of the scheduled timetable (Sawers 2024). Starting in 2020 with the schedule change, on-time performance shot up to nearly 94 percent and has stayed at that higher range since then.
The results of this schedule change have yielded substantial ridership growth for MBTA’s commuter rail services. Weekday peak ridership is still well below its pre-COVID levels, but midday and evening ridership is much higher. Even more, weekend ridership is setting all-time records, with ridership up more than 215 percent of its 2019 levels.46
Other Factors
When it comes to MBTA’s successes, staff attributes increased commuter rail ridership to the following factors:
- Focus on all-day bi-directional service
- Service expansions to include late night and weekend improvements
- Good on-time performance
- Fare promotions, including $10 all-weekend fare, five-day flex passes, and 10-ride tickets
- Extensive marketing campaigns focusing on expanding the rider base beyond commuters
- Traffic congestion and the Boston employment market (Sawers 2024)
Although multiple factors contribute to MBTA’s ridership growth above its peer agencies, it is the change in schedules that is the most noteworthy departure. Other legacy commuter rail providers have tested fare promotions and marketing campaigns and have employment related to hospitals and schools similar to the Boston market.47 However, the largest difference in ridership is the wholescale revamping of schedules and the related boost in on-time performance that has occurred at MBTA.
The MBTA team took advantage of the disruptions of COVID-19 to change its operating paradigm. MBTA also owns and controls most of the infrastructure on which it operates. However, the network poses several challenges that make adjustments difficult. For one, significant portions of the network are single tracked. MBTA has plans to add strategic placements of new double-track sections in the future, but it needs to design its bi-directional schedules with timed
meets. The system also shares tracks with freight trains, which require capacity for movement during the day and at other times when commuter trains are not operating. This requires operational discipline and the development of more robust schedules that allow the operations to increase on-time performance.
Another lesson is that the significant change in timetable did not result in significant pushback from the riding public at the time because only a fraction of the ridership was using the service. Now that ridership is close to 2019 levels, MBTA staff receives some objections from riders and elected officials when schedules change, and, in some cases, staff had to reinstate specific services to accommodate those requests. Today, MBTA has a different mix of passengers than it did 5 years previously, with most of the current riders being new to the system compared with 4 years ago. MBTA is undertaking a study to better understand the markets and riders in the region to continue to build on its growth.48
5.2 Implementing a New Fare Policy: Metra Commuter Rail
During the COVID-19 pandemic, the Northeast Illinois Regional Commuter Rail Corporation (dba Metra), like other systems across North America, encountered numerous difficulties resulting from a precipitous drop in ridership. Similar to its North American peers, Metra used price promotions (among other tactics) to attract customers back to the service. These additional fare products were added on top of the existing 10-zone fare structure, which had been in place for decades. The complexity of this fare system led Metra staff to simplify their fare structure. Metra implemented a new system in February 2024, meeting its goals of simplifying service for users, encouraging ridership based on new travel patterns, and simplifying fare collection.
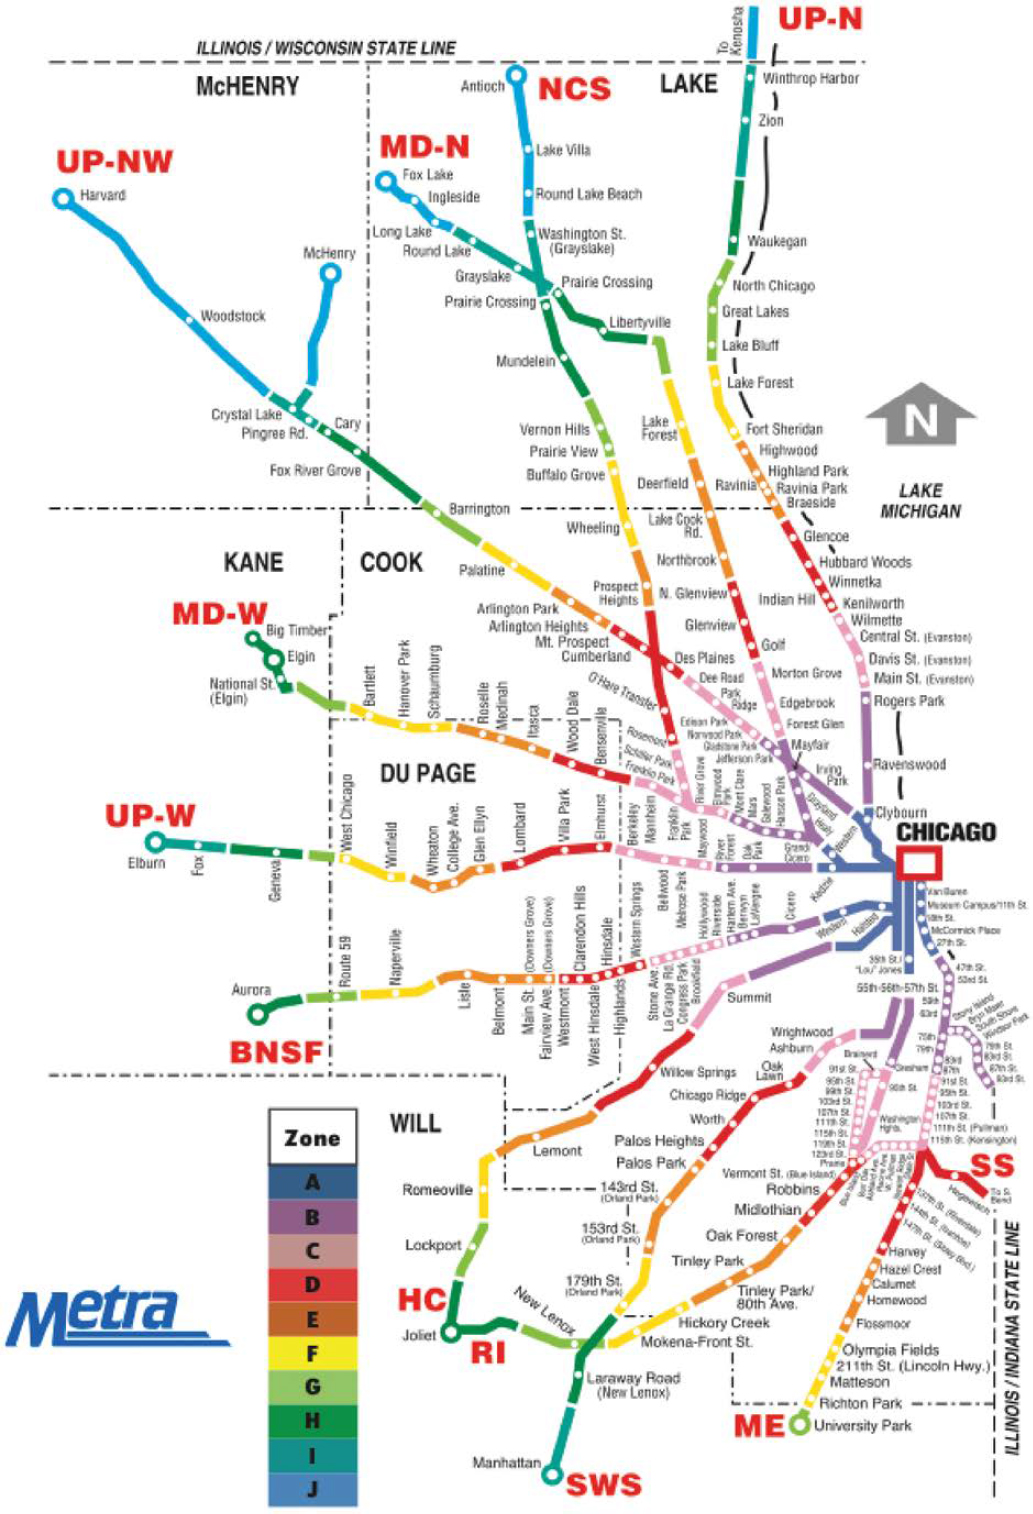
Metra is the regional agency that oversees and operates the 11-line commuter rail network in the Chicago region. With 242 stations over 487 route miles, it is the busiest commuter rail network outside the New York City region and carries approximately 163,000 daily weekday riders.49 The infrastructure is owned by a combination of freight hosts, Amtrak, and Metra itself, and its operations are managed through a mix of contracted services and in-house efforts.
Metra began operations in 1984, taking over funding, oversight, and some operations for commuter services from several private railroads. Metra inherited a zone-based fare structure and operated under an Illinois state law requiring the agency to receive at least 50 percent of its operating revenues from fares.50 The fare system included monthly passes, often subsidized by employers with a corresponding federal income tax credit designed to encourage use 5 days per week.51 In 2021, the Illinois General Assembly passed a temporary relief of the 50 percent rule, which would have been impossible to meet with depressed ridership without dramatic cuts to service.52 The relief remains in effect as of the time of this writing, and it helped Metra staff rethink approaches to fare structure and collection.
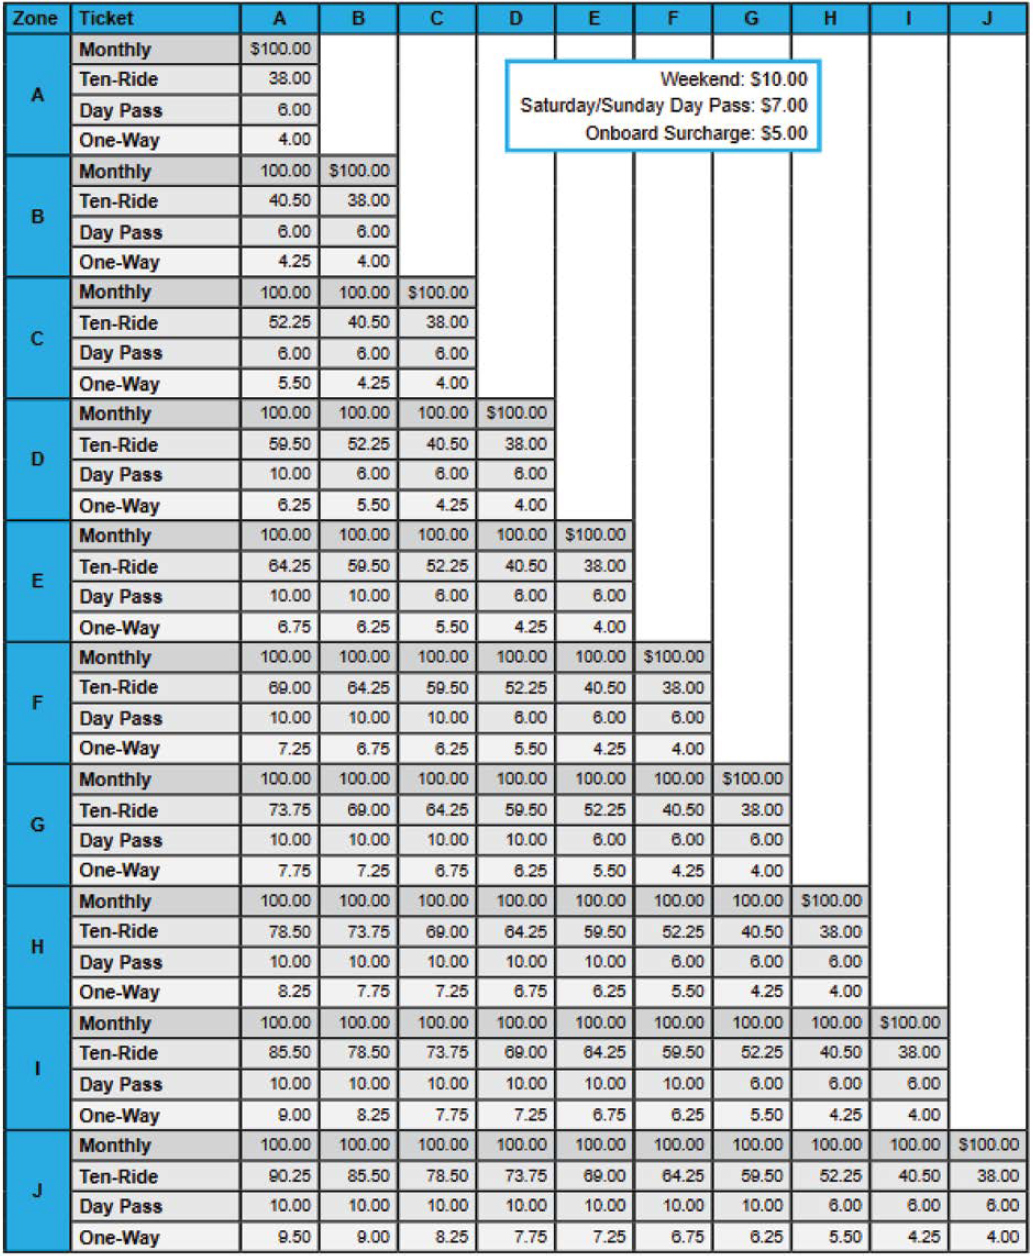
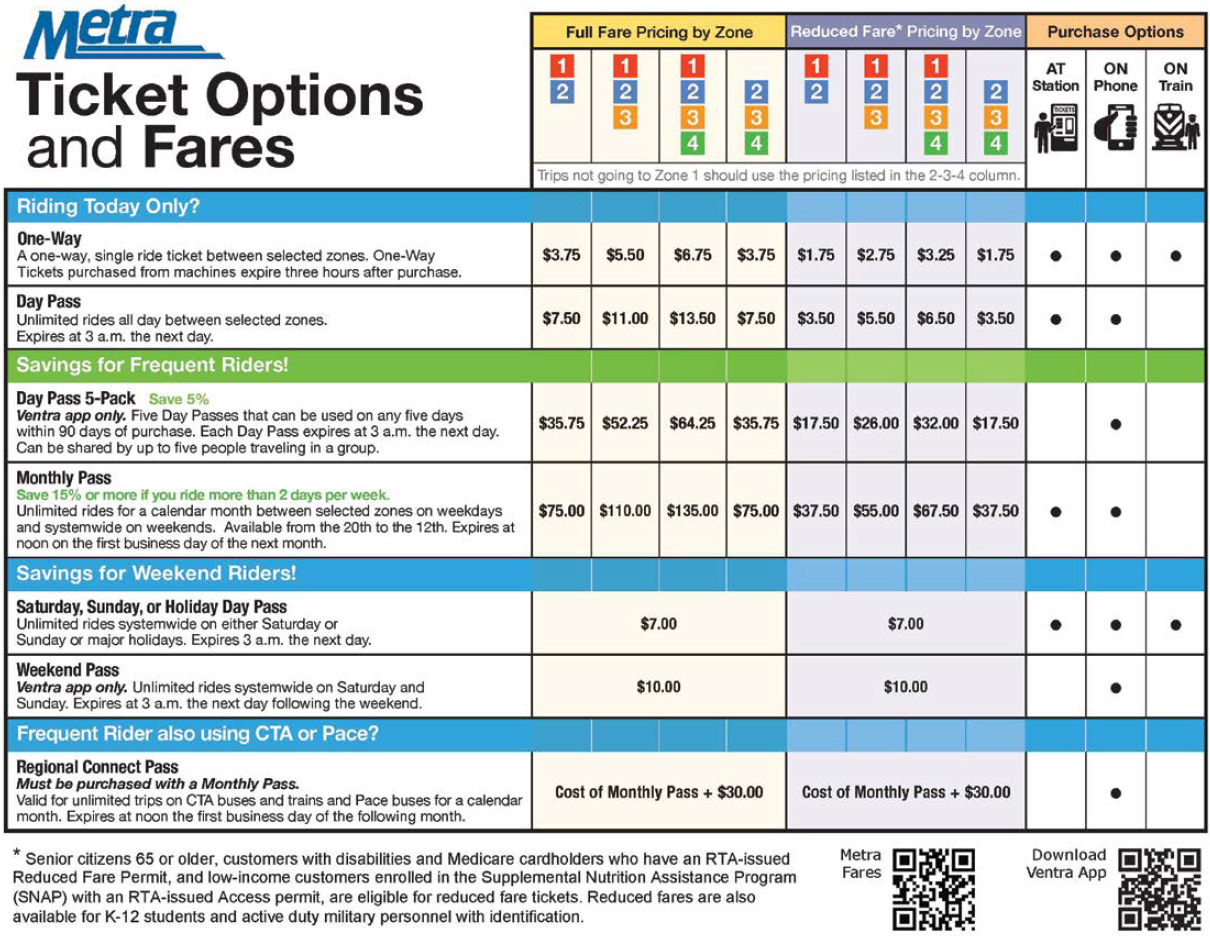
Before 2024, Metra used a 10-zone fare system, with monthly passes, 10-ride tickets, day passes, and one-way passes priced based on how many zones a traveler would be crossing, as shown in Figures 14 and 15. During the COVID-19 pandemic, Metra tested several different fare promotions, including $10 day passes, $6 day passes for three-zone trips, and the $100 unlimited monthly pass (which was previously priced as high as $250 for the farthest zones), as shown in Figure 15.
When tasked with creating a new fare structure, Metra set the following goals:
- “Encourage ridership while working within financial and technical constraints.”
- “Create a system that is easily understandable for customers.”
- “Simplify on-board fare collection as much as possible.”53
While Metra still had relief from the 50 percent rule, leadership felt it was important to have a new fare structure that did not negatively affect the budget. Per the first goal, the objective was to create a new fare structure that would meet or exceed the revenue of the then-current fare structure, including any existing discounts or promotions.
The planners also reviewed different ways to simplify fare collection. Metra riders have the option to pay cash on-board, use ticket vending machines (with cash or card), or use the Metra app. Part of the purpose of providing these options was to encourage passengers to make fewer on-board cash payments, which are time-consuming for staff and require significant back-office resources.
Staff began considering options for a new fare structure in 2022, using a peer review of similar agencies across the world.54 They considered peak pricing, station-to-station pricing, express-based pricing, flat fares, larger distance-based zones, and consolidated zones based on distance and natural market barriers. Metra staff also reviewed the effects of different pricing strategies on Title VI, ensuring the new system would not overly affect low-income and minority riders in the region.
Metra staff also created a working group composed of employees in roles across the organization.55 As part of the working group, they involved crews, operations, finance, and other departments that would be directly and indirectly affected by the proposed changes. Metra staff also sought public feedback, using a web page, an online survey, pop-up informational meetings, and a virtual open house. More than 14,000 people provided input.
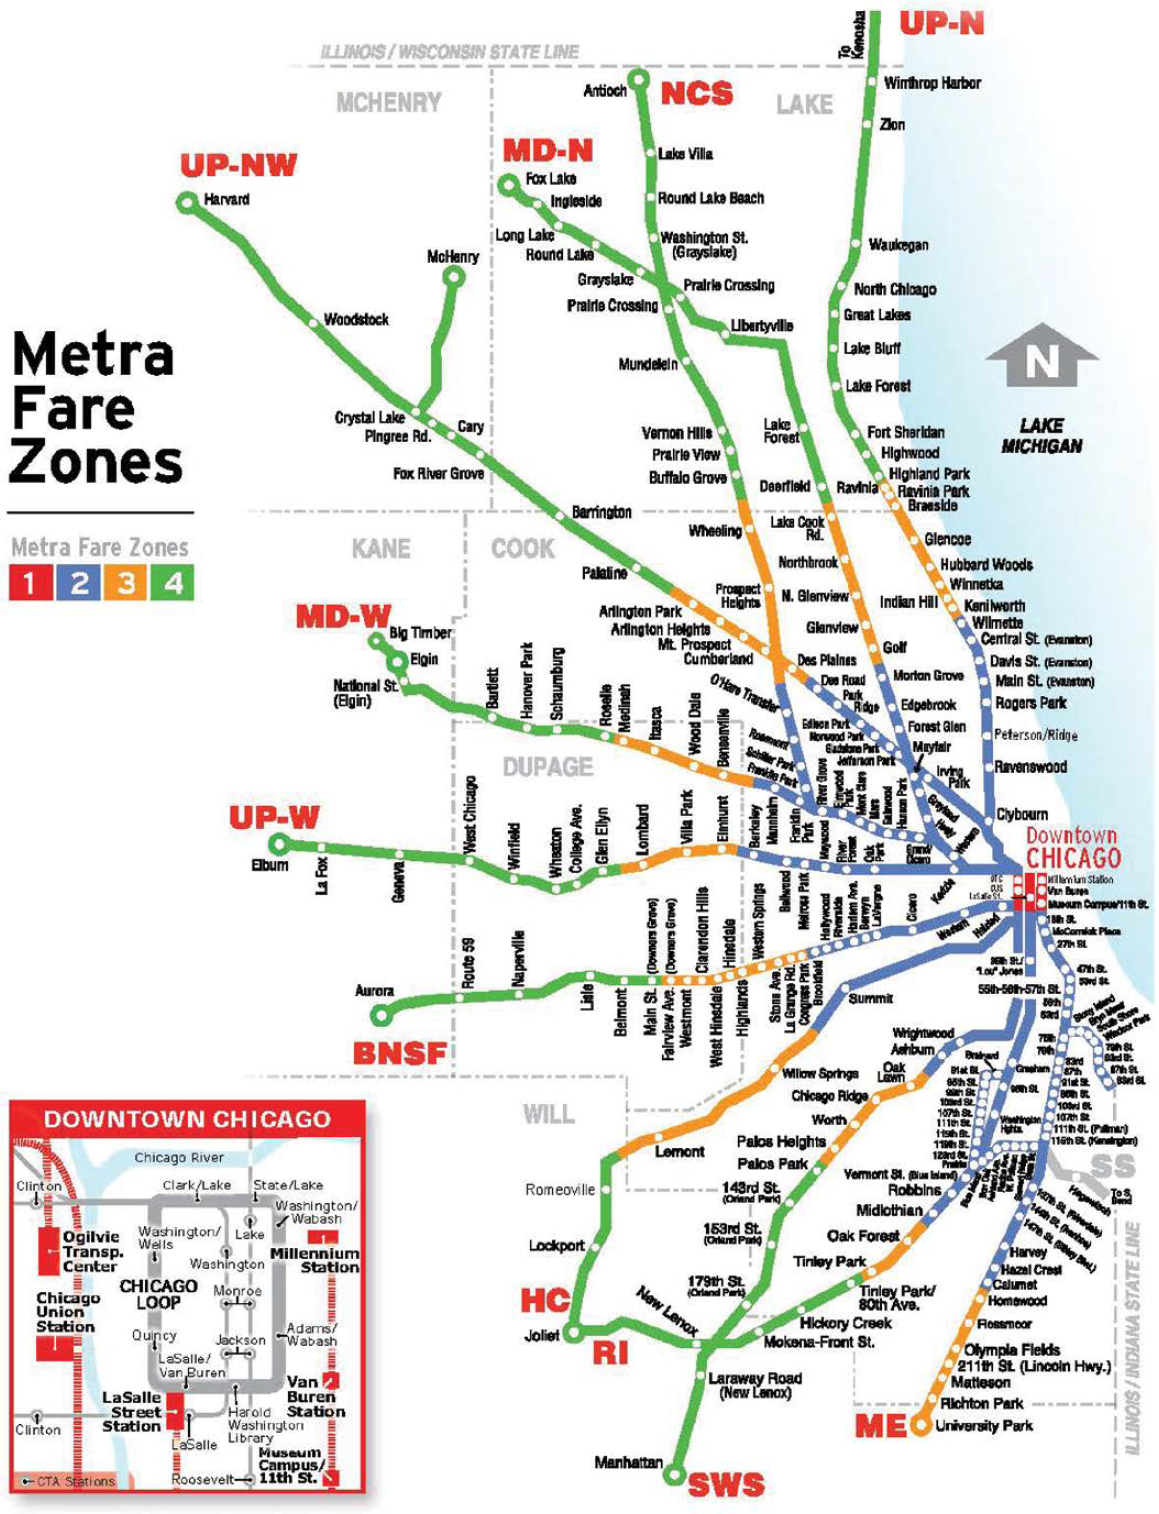
After stakeholders and the Metra Board of Directors provided input, the staff created a final proposal for approval. The new fare system, which was eventually approved and is shown in Figures 16 and 17, reduced the number of zones from 10 to 4, with the zones based on the market characteristics of each line. The staff standardized the fare products to match the zones and eliminated the 10-ride ticket for a five-pack of day passes, reducing the possibility of unpunched tickets while encouraging use of the mobile app. They also changed the pricing of the monthly pass to reflect that most commuters are coming into Chicago for 3 days per week instead of 5.
The new Metra fare system was implemented on February 1, 2024. The rollout included the installation of more vending machines at busy stations, the closing of ticket windows, and altered fare costs and merchandise.56 Metra is also planning to pilot a cashless on-board system on the BNSF line, where ticket vending machines can accept cash on platforms (on-board cash payments are still collected). However, the first few weeks were not without challenges. Metra reported their app, which handles 80 percent of the fares, crashed several times when it experienced back-office issues with the transition.57 There were also issues with ticket vending machines, which were problematic with the closed ticket windows. However, after a few weeks, these issues were mostly resolved.
According to Metra’s survey of passengers before implementation, the fare plan received positive feedback overall.58 More than half of the respondents approved of the proposed fare zones. Furthermore, a sizable majority said that under the new fare structure, they would ride Metra just as much or more.
This research attempted to determine whether the new fare structure resulted in a measurable change in ridership following the implementation of the new fare structure. Ridership on the system between February 2024 and September 2024 (most recently available) was up 9 percent from the same period in 2023.59 However, other factors besides fare policy could be driving that increase. For example, Metra offered more service, with revenue vehicle miles up 2.5 percent during the same period.60 Chicago office occupancy also increased slightly during the same time-frame.61 Unfortunately, the data are not definitive on whether the new fare policy increased ridership, but the change did not appear to affect it negatively.
Metra’s simplification of the fare system appears to have several benefits and potential lessons for other commuter rail properties:
- Reducing the fare products and zones has not led to a decrease in revenue for the agency and might have encouraged more riders.
- By pricing all trips not bound for downtown at the lowest price, the new structure encouraged non-downtown trips, and the agency reported an uptick in those types of trips.62
- The new system had some technical challenges at the beginning but has otherwise proved to be an uncontroversial and beneficial improvement.
Metra staff employed extensive internal and external engagement when considering new fare policies and products, including “pop-up” meetings in downtown stations, customer announcements, and direct interaction with on-board staff. The insights into how changes affect commuter rail operations, markets, and travel habits provided critical feedback on how to refine zones and which proposals, such as peak and express pricing, to avoid. Challenges with the rollout suggested that more technical testing needs to be performed before the launch to avoid problems during the transition. Regardless, the relatively smooth overhaul of the fare system was implemented at a time when ridership was still lower than before the COVID-19 pandemic.
5.3 Electrification of Commuter Rail: Caltrain
Most commuter railroads use diesel fuel to power their trains, but electrification can help improve timetables and meet greenhouse gas reduction goals. Electrified commuter railroads have been limited to the legacy operators along the Northeast Corridor, select lines on the South Side of Chicago, and the commuter rail system in Denver, which is a new build. With the exception of Denver, these railroads were electrified decades ago, and there has not been any new electrification on an existing mainline commuter railway for nearly 30 years, when the northern end of the Northeast Corridor was electrified between Boston and New Haven (FTA 1995). The exception is the electrification of the Caltrain line between San Jose and San Francisco, which began fully electric operation in September 2024.63 The upfront costs and organizational complexity to electrify a railroad are immense but so are the benefits, which include reduced carbon emissions, quieter trains, and faster schedules.
This case study examines the electrification of the Caltrain corridor between San Francisco and Tamien station, 2 miles south of San Jose. The Peninsula Corridor Joint Powers Board (dba Caltrain) operates a commuter rail line in the San Francisco Bay Area, spanning 77 miles between San Francisco’s 4th and King Street terminal along the San Francisco Peninsula beyond San Jose to Gilroy, California.64 The service was historically oriented around bringing commuters to work from the residential areas along the peninsula, not only to San Francisco, Palo Alto, and San Jose, but also to numerous commercial centers in between. The service featured bespoke stopping patterns and express trains.65 Caltrain carried an average of 1,468,441 monthly riders in 2019. Due in part to historically low office occupancy in the Bay Area, the system recovered only 37.2 percent of that ridership by June 2024 (Caltrain Planning 2024).
While it has benefits for today’s system, Caltrain electrification was not initiated because of the change in travel markets starting in 2020. Initial feasibility studies were published in the 1990s, and the project started in earnest when California High-Speed Rail decided to share the right-of-way with Caltrain following the passage of Proposition 1A in 2008. Electrification was required because of California High-Speed Rail trains using the Caltrain corridor to reach San Francisco, trains which would use only overhead electrification.66 The agency pursued it in part because of the funding agreement with the High-Speed Rail Authority and in an effort to meet regional air-quality goals by switching from diesel-hauled trains.67
The project broke ground in 2017, with testing of trainsets beginning in 2023.68 Caltrain took this opportunity to order brand new electric multiple units to replace their aging fleet with an all-new fleet of multi-level Stadler KISS electric multiple units. The agency also overhauled its timetable to take advantage of the better acceleration and performance of electric trains.
The new schedule regularized stopping patterns into one local pattern, which operates half-hourly all day, every day and two hourly limited stop patterns at the weekday peaks.69 They also doubled weekend service frequency from hourly to half-hourly. The improved train performance is particularly helpful for the all-stop local patterns: The end-to-end express trip now takes 59 minutes, compared with 65 minutes previously, and the local trip time decreased from 100 minutes to just 77 minutes. As a result, customers have more frequent service, regular headways, and faster trips for most markets.
At the time of this writing, the full impact of the new schedules on ridership is not known, considering they were implemented on September 21, 2024. However, preliminary results show significant increases in usage. October 2024 ridership increased by 17 percent from August 2024, to 753,386 from 642,231, and increased by 54 percent from October 2023. Weekend ridership increased at a greater rate, reaching over double the pre-pandemic weekend ridership.70
Caltrain did not necessarily receive operational cost savings associated with electrification. Although early analyses indicated electric costs to be less expensive than diesel fuel purchases,
recent increases in California electricity prices have raised energy costs statewide, affecting Caltrain.71 Regardless, Caltrain staff cited the better performance of the electric trainsets that enable improved schedules and higher ridership, as well as improvements in Caltrain’s environmental footprint.72
Electrification has allowed Caltrain to reduce trip times on a dense corridor with short station spacing, and to run more frequent mixed express and local service, without triggering the need for additional infrastructure or scheduled overtakes.
Electrification will not be right for every commuter rail provider, but other lessons from Caltrain’s experience are more broadly applicable. For one, providers considering electrification should expect the project to be expensive and time-consuming. This case study is not investigating project delivery, but projects of this magnitude can take a decade or more to implement. Setting a strategic plan with incremental steps to get to electrification will be needed. Providers should also consider the multiple benefits of electrification as part of their justification, including climate benefits and faster run times, particularly for schedules with many local stops. This justification will help providers evaluate whether it is worth the additional costs associated with installing the electric catenary systems.
5.4 Overcoming Funding and Institutional Barriers to Making Timetable Changes: Metrolink
Commuter railroads regularly make minor adjustments to their schedules based on changing travel demand, equipment, infrastructure, and other factors. These small tweaks are relatively easy to implement and generally acceptable by the riding public, the provider staff, and the governing body. However, wholesale change is much more difficult. As commuter railroad providers consider broadening their operating model from a commuter-focused service to a balanced, all-day network, agency and other regional leadership often need to identify additional funds and convince their riders that the change will be worthwhile to them.
In October 2024, the Southern California Regional Rail Authority (dba Metrolink) implemented a new schedule across its eight lines (including the Arrow service), resulting in regular, all-day, bi-directional service on all lines.73 The new timetable also involves coordinated schedules at Los Angeles Union Station and shifting some peak trains to off-peak times. Although the concept for a region-based system was on the table for years, the agency’s board took action in 2024 to identify additional funds and communicate with the public about the change.74 This case study reviews the decision-making process and implementation strategies at Metrolink during its 2024 schedule change.
Metrolink is the commuter rail provider that provides service in the Los Angeles region. It is governed as a regional authority that shares powers with the five county transportation commissions that represent the five main members of the authority. Funding comes from each of those county transportation commissions and, to a lesser extent, from the State of California.75 The system consists of eight lines, six of which radiate from Los Angeles Union Station. Metrolink operates its service under contract; it uses its own infrastructure (or that owned by the member agencies) and shares infrastructure with BNSF, Union Pacific, and the North Coast Transit District on some of its lines.
Since commencing service in 1992, Metrolink followed an operating model in which most trains arrived at Los Angeles Union Station in the morning peak, the trainsets and crews parked nearby during the day while crews waited in daily hotel rooms, and then the trains returned to their suburban locations during the evening peak.76 While this model had natural operating inefficiencies, it served the downtown Los Angeles office market well. Ridership grew steadily until 2012, when it started to level off at about 14 million passenger trips annually (Figure 18).
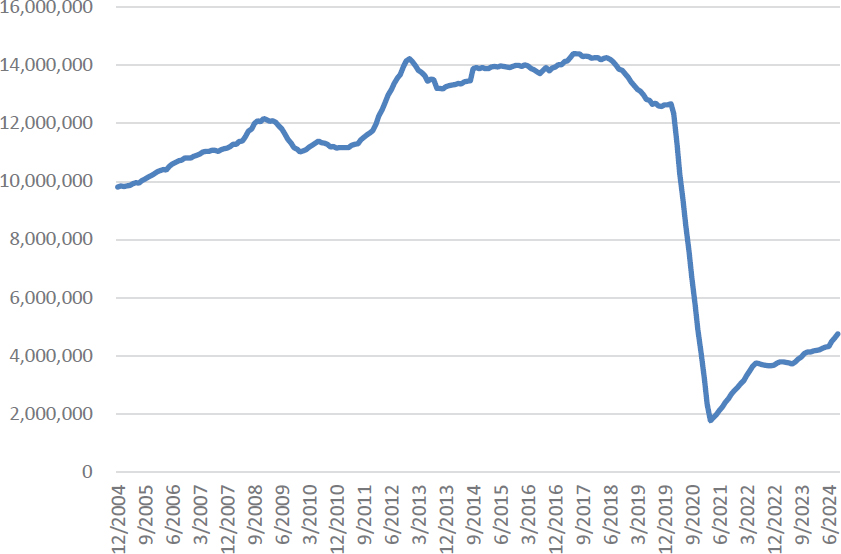
Figure 18. Metrolink rolling 12-month ridership.
Metrolink began to rethink its operating model with the launch of the Southern California Optimized Rail Expansion (SCORE) Program. SCORE is a $10 billion Metrolink improvement program, of which $2 billion is funded to complete service improvement projects ahead of the 2028 Olympics. This first phase of SCORE aims to target reliability and boost service frequencies to 30 minutes in both directions on most lines and includes significant infrastructure upgrades to enable synchronized movement and for capacity and redundancy.77 The first grant in the SCORE Program from the California Transportation Commission in 2018 was $6.5 million for design, rail operations modeling, and environmental assessment of the first projects.78
While SCORE is advancing in part to meet mobility needs for the 2028 Olympics, its advancement is also a recognition that the Los Angeles region is polycentric, with different job and population centers spread throughout the region.79 An all-day, bi-directional service with timed transfers at Los Angeles Union Station creates a service that should attract a broader range of trips. The SCORE Program and its related investments are intended to reverse the decline in riders seen in the few years before the COVID-19 pandemic.
The entire system’s schedule did not completely change in October 2024. In fact, some of the lines had already started to switch to a regional rail style with regular bi-directional operation. The Antelope Valley Line, for example, changed to all-day hourly service in October 2023 as part of an effort to restore pre-COVID service levels and spread service throughout the day.80 The San Bernadino Line also switched to hourly service in 2023, providing consistent, regular service throughout the day.
The October 2024 service change represented the largest shift in the system timetable, affecting all lines. In all, the system increased daily train roundtrips by 33 percent, vehicle revenue miles by 21 percent, and daily station calls by 23 percent (Table 6).81 The new timetable also optimizes connections at Los Angeles Union Station, San Bernardino Transit Center, Orange, Riverside, and other places where the network meets. The number of connections between Metrolink lines that can be made in fewer than 20 minutes increased by more than 300 percent.82
Table 6. Metrolink timetable change effects on operating parameters.
| Operating Parameters | April 2024 Service | October 2024 Service |
|---|---|---|
| Active trainsets | 38 | 35 |
| Daily round trips | 130 | 174 |
| Vehicle revenue miles | 8,600 | 10,400 |
| Daily station calls | 1,610 | 1,987 |
Source: Metrolink, 2024.
The new timetable took advantage of the natural efficiencies of running all-day service, using the trains and crews that would otherwise be idling during the middle of the day. The 23 percent increase in service was thus achieved with the system running fewer trainsets.83 While the operating costs did increase, some of it was part of an effort to restore pre-COVID levels of service to the region. However, because ultimately more train miles were traveled than anticipated, the board did need to increase the operating budget by $14.1 million in fiscal year 2025 over its approximately $132 million operating baseline. This is an approximately 10 percent increase in cost for a 23 percent increase in service.84
Metrolink and its service expansion required its member agencies to increase their subsidies to support the additional $14.1 million. Despite the anticipation of additional riders, Metrolink used conservative forecasting that indicated new fare revenues would not fully cover the new costs. In 2019, Metrolink covered about 40 percent of its operating expenses using fare revenues. After the pandemic, in 2023, fare revenues covered only 12 percent of operating expenses.85 Although farebox recovery continued to climb in 2024 as ridership increased, the lower farebox recovery ratio required the board to contribute additional funds to develop the service.
The board was convinced that funding this dramatic change to the entire timetable was a significant step in the evolution of Metrolink service. When the detailed schedule change was presented to leadership at a January 2024 board meeting,86 three primary factors helped to demonstrate that the change would be worth the investment.
First, the presentation to the board included a market analysis. Metrolink staff used Streetlight data and other travel information to show there was significant travel demand outside peak times. Given that most Metrolink lines did not historically provide significant service outside the peak, the service did not capture that demand well. While the analysis did not project specific ridership numbers using a demand model, it was clear to policymakers that capturing even a small portion of untapped markets could be a significant boon to the network.
Second, Metrolink staff also showed how the redesigned schedule would use Los Angeles Union Station as a hub for pulsed service. A pulsed service is one with repeating schedules, whereby trains could be timed at Union Station to allow for facilitated transfers between Metrolink lines. This allows the Metrolink network to serve a much broader range of trips. For example, staff presented a hypothetical trip between Pomona and Van Nuys, which with the old timetable would take 5 hours and 49 minutes (previously, it was not possible to transfer from the San Bernardino Line to the Ventura County Line for most of the day). The October 2024 schedule adjustments enabled regular transfers between the two lines, with transfers taking place within 10 minutes, cutting the end-to-end trip time down to 88 minutes and making that connection possible throughout the day.
The last factor cited was the board member experience. Many of the board members use the system regularly to attend meetings in downtown Los Angeles, such as the monthly board meetings held at the Metro headquarters adjacent to Los Angeles Union Station and meetings of the Southern California Association of Governments (the metropolitan planning organization)
for Southern California. The direct experience with Metrolink service helped to clarify the limitations of the system. For example, many board members had limited travel options when their meetings were expected to end during a significant midday service gap. When the San Bernadino and Antelope Valley lines added midday service, more options became available, and the benefit of future timetable improvements became clearer to the group. Their personal experience helped demonstrate the value for many other future trips.
The timetable change did have negative effects on some riders. Metrolink staff acknowledged that, particularly with infrequent commuter rail service, there is a sense of community on many trains and many riders build their lives around the timetables. Moving a train a few minutes, let alone more than 30 minutes, can have significant effects on individual schedules and pose a trade-off for leadership. For example, in some cases, peak-period trains were cut and redistributed throughout the day. Although this change was tough for some riders, it was justified based on the market of potential midday riders for the region and the relatively slow rate of demand growth in primary corridors.
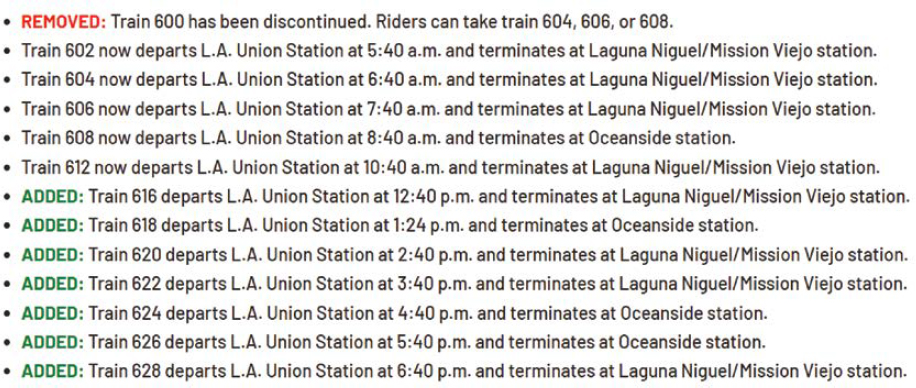
Metrolink made efforts to engage with stakeholders and riders to communicate the change ahead of the schedule’s implementation. Figure 19 shows a detailed excerpt from the Metrolink website showing how schedules changed on the Orange County line, informing riders of trains moved, added, and canceled.87 The website contains additional information, including a “why did you cancel my train” response.88
At the time of this writing (fall 2024), it is too early to know what long-term effects the schedule change had on ridership. During the first three weeks, ridership increased by nearly 6 percent compared with the three weeks before the change.89 This increase occurred despite a challenging rollout, with delayed trains on some lines and issues adjusting to the new operations. Metrolink cited conflicts with BNSF freight trains as some of the primary causes of delays and promised to work to resolve issues related to crowded cars.90 They anticipate some minor adjustments to the schedule to increase reliability but plan to keep the overall structure.
The Metrolink schedule change offers a few lessons for agencies considering implementing a significant change to their timetables. For one, it is important to communicate the benefits to current and future riders. Metrolink used many avenues of communication, such as its website, as well as announcements and posters in stations and on trains. Metrolink started the process as part of the preparation for the 2028 Olympics, then used travel data to show how changes in travel patterns favored an adjustment. Metrolink also communicated how the new service
would affect operations and infrastructure, including efficiencies and additional costs. This clear communication with the board helps to justify the additional expenses needed to boost service.
5.5 Operational Readiness for Future Schedule Implementation: FrontRunner
Changing a service timetable is a significant effort that requires careful implementation. Commuter railroads are generally accustomed to small schedule adjustments, such as adding a single new train slot or adjusting timing along the route. The operational teams have the experience and skills to adapt to and handle minor changes that come from the scheduling teams. However, completely switching to all-day bi-directional service or doubling frequency, for example, is particularly challenging, especially when the goal is to have a lean schedule and limited resources for infrastructure expansion.
To avoid overbuilding infrastructure or procurement of redundant resources, some providers are using operational readiness planning, an initiative to prepare a deployment plan for new service. The collaborative approach to operational readiness planning empowers the operational teams to plan for common occurrence disruptions (e.g., trespassers, weather) and more easily meet the goals of the planned service.
This case examines the UTA FrontRunner service and its steps to implement a new timetable. FrontRunner is a regional rail service in central Utah. It spans 83 miles and serves the greater Salt Lake City region, with Ogden as its northern terminal and Provo as its southern terminal. FrontRunner operates 6 days a week across 16 stations.91
FrontRunner is planning a 2030 schedule change that will significantly expand service. UTA is increasing service frequencies to meet the growing demand, as shown in Table 7, which outlines the expanded service levels and the new requirements for equipment and infrastructure.92 Not only must UTA expand its operations, but the shorter headways and planned single-track sections must also allow smaller margins for error. The current on-time performance is approximately 93 percent (defined as arriving within 5 minutes of the scheduled time at a station), and the agency wants to continue to meet or exceed a target of 95 percent in the future.93
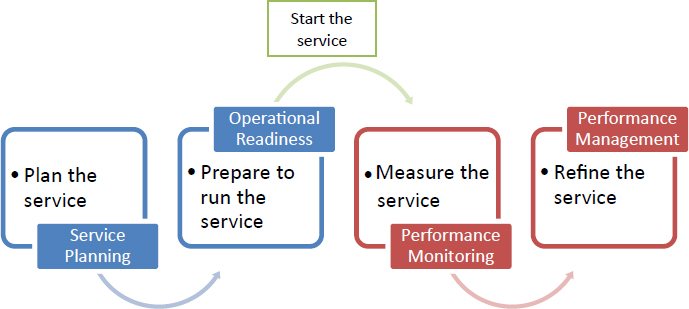
UTA launched an operational readiness program in summer 2024 to bridge the gap between planning and actual service, as illustrated in Figure 20.94 The leadership recognized that a well-designed timetable alone does not ensure smooth operations, so this program empowers teams to mitigate risks. UTA’s goals for its performance management program are to know the plan and to execute strategies the same way as often as possible. The goal is not to remove the need for agility but to decrease variability in the process. This way, frontline leaders can evaluate effectiveness, debrief, and change processes thoughtfully while protecting consistent service. Operational readiness contributes to this ultimate goal through preparation.
One of UTA’s primary motivators for initiating its operational readiness program is a previous 2013 schedule rollout, which experienced issues with system recovery (restoring service to the
Table 7. FrontRunner current and planned timetable overview.
| Current Service (2024) | Planned Schedule (2030) |
|---|---|
| 61 trains on weekday | 105 trains weekday |
| Peak trains every 30 minutes | Peak trains every 15 minutes |
| Off-peak trains every 60 minutes | Off-peak trains every 30 minutes |
| 10 trainsets required | 18 trainsets required |
| Mostly single track with sidings | Sections of new double track, one new station |
Source: UTA, 2024.
published schedule after train delays) (Lee 2013).95 Building on that experience, FrontRunner is being proactive for its 2030 schedule.
UTA leadership has prioritized a continuous improvement mindset grounded in collaboration and open-mindedness. Beginning in 2017, the Utah Transit Authority launched an official agency-wide continuous improvement program for all staff. Participants in the program attend regular meetings, develop book reports, participate in external and internal tours, and work with a mentorship program.96 The program is completed within a calendar year, resulting in certificates for participants. UTA staff find the program fundamental to the culture of UTA as an agency, and it has helped serve as a foundation for the operational readiness program at FrontRunner.97
As part of its operational readiness effort, UTA held interactive sessions with department heads and subject matter experts to evaluate the proposed schedules. The topics covered were operations, dispatching, capital development, labor/crewing, customer service, maintenance/yards, fleet, and communications.98 The sessions included a presentation of the proposed service plan, followed by a close review and revisions to the process.
Sessions included the following tasks:99
- Review existing processes and operational strategies
- Communicate the proposed service plan
- Evaluate and revise current processes
- Document process changes in an operational playbook
- Evaluate different recovery scenarios to observe department responses
- Align the training program and schedule to continuously improve the playbook
- Inform any plan changes identified to protect service (e.g., redundant crossovers for mainline recovery, “protect” trains from mechanical failure)
The sessions included role-playing exercises to test different risks and scenarios to provide life-like training experience and risk review. For example, staff analyzed a scenario whereby northbound and southbound trains are scheduled to meet at South Jordan Station, a double-track station in single-track territory.100 In this test case, a northbound train was delayed by 5 minutes because of police activity at the previous station, Draper, causing it to potentially miss its meet. One option was to advance the southbound train to maintain its schedule. However, the analysis showed that this option would cause significant delays for the northbound train, disrupting future meets and leading to further cascading delays. Ultimately, the team concluded it was best to hold the southbound train at South Jordan, thus delaying it an equivalent 5 minutes, to prevent a chain of delays. This example solution was included in the playbook, and the team now has a baseline approach.
Successful implementation of operational readiness required leadership commitment to investment and agency-wide participation. As part of the process, UTA developed new training programs and made some adjustments to the 2030 timetable and infrastructure plans.
UTA’s experience demonstrates the importance of ensuring new timetables are operationally feasible. An agency-wide collaborative process to review future schedules allows necessary adjustments to be made in advance. This approach also enables UTA to develop a playbook for handling real-time challenges, informing decision-making to minimize delays and ensure the seamless implementation of the new timetable.
5.6 Developing Strategies for Transit-Oriented Development: CTDOT Commuter Rail
Transit-oriented development (TOD) is the strategy of combining transportation and land use policy to create dense, walkable, and mixed-use spaces near transit stations.101 Studies show that TOD increases transit ridership, as well as bicycling and walking (Brinckerhoff et al. 2002). TOD is less common for commuter rail, as many stations serve older town centers or park-and-ride lots. Under the right conditions, encouraging TOD can be a way to increase ridership on commuter rail lines, particularly when coupled with higher-frequency, bi-directional service.
This case study examines the efforts of the CTDOT to coordinate the local planning efforts of Connecticut municipalities more closely with its own transportation goals and efforts.102 Recent TOD initiatives around CTDOT rail stations demonstrate benefits for both transportation and development when the two are planned together and coordinated.
Connecticut sponsors three passenger rail services in the state: Metro-North’s New Haven Line, CTrail’s Shore Line East, and CTrail’s Hartford Line. The Shore Line East and the New Haven Line and its branches are technically commuter rail and are within the scope of this research.103 However, the Hartford Line is relevant to this research, with similar frequencies (10 round trips per day, or 18 round trips per day if you include the parallel Amtrak services) and a similar length (62 miles) to many commuter rail lines around the United States and Canada.104 The Hartford Line service began operation in 2018, supplementing the limited Amtrak service along the same corridor. In this case, the effects of TOD on ridership and system performance are not significantly different on the Hartford Line, as they would be for the other commuter rail services in the state.
In December 2012, Governor Dannel Malloy announced the creation of an interagency TOD task force to coordinate the actions of multiple state agencies to facilitate economic benefits from state transportation investments.105 The vision for the TOD task force was to identify development opportunities within the communities surrounding transit stations. Specifically, CTDOT and other public bodies in Connecticut own large amounts of land in and around communities, usually parking lots or underutilized land. These sites provide the lowest-hanging fruit for TOD, often being directly adjacent to transportation facilities (CTDOT 2017). Also, to encourage wider development beyond publicly owned land, CTDOT provided its institutional support on the Hartford Line through an FTA TOD planning pilot grant for rezoning and code updates seen as transit friendly.106
Since 2010, 3,500 residential units and 1.2 million commercial square feet have been planned or constructed along the Shore Line East, 4,200 residential units and 1.5 million square feet of commercial space have been planned or constructed along the Hartford Line, and 24,000 residential units and 3.5 million square feet of commercial development have been planned or constructed on the New Haven Line.107
Through the TOD initiative, CTDOT partners with local, regional, state, national, and private bodies to create successful TOD projects. These partnerships range from rezoning efforts with local municipalities to working with private landowners near transit stations to redevelop property. CTDOT cites the engagement of key stakeholders as a reason for the success of the TOD efforts in the state (CTDOT 2017).
CTDOT is working to further encourage TOD, recognizing that not all communities want development and that land use policy remains a local function. In 2024, the department created a dedicated TOD position in the commissioner’s office tasked with working with municipalities resistant to new development, places with untapped development opportunities, and local governments without the resources to complete the necessary planning work to support new developments. Most TOD planning typically happens at a local level, but the new TOD position may take on more planning work to assist smaller communities that might not have the resources to do it themselves.108
Successful TOD cases are typically measured in total development costs, residential units completed, and square feet of commercial or other development space. For the purposes of commuter rail systems, newly built TOD around stations can induce significant positive ridership and, more broadly, a cooperative partnership between CTDOT and the local communities to better align transit and development in the long term (CTDOT 2017). The following examples show development of existing state-owned land, revised zoning, and relocation of stations that enabled more TOD opportunities:109
- Berlin. Underdeveloped land surrounding the Berlin train station was redeveloped into a mixed-use site to better integrate the station into the surrounding community.110 The station was also reconstructed.
- Enfield. A new station is planned in Enfield to bring Hartford Line service to a town currently unserved by rail. This case is an inversion of the typical TOD model in which development is situated near transit and is instead more of a “development-oriented transit” model in which new transit service is provided to an area that is already developed enough to justify the service. Additionally, a new mixed-use high-density development is planned, spurred by the planned station and rail service.111
- Meriden. TOD projects created new housing developments, established a new bus transit center, and created a new park next to the reconstructed rail station. The developments were a joint effort of CTDOT, Meriden Housing Authority, and the Connecticut-based Westmount Development Group and were seen as supportive developments creating a self-sustaining ecosystem of destinations, with the goal of revitalizing downtown Meriden.112
- Naugatuck. Naugatuck Station, on the New Haven Line’s Waterbury Branch, is currently being relocated. The plan cites relocation to a straight track to allow for high platforms and provide space for a future second track and to better align the transportation facilities with the Borough of Naugatuck’s TOD vision along Old Firehouse Road between Rubber Avenue and Maple Street, where there is significant underused land for development.113
- Wallingford. The original station was relocated a few blocks north and replaced with a new modern structure in 2017, which coincided with the adoption of a TOD plan by the Town of Wallingford and the opening of the Hartford Line service in 2018 (Fitzgerald & Halliday, Inc. 2016; NHHS Rail 2016; CTDOT 2017).
- Windsor Locks. Windsor Locks station, on the Hartford Line, is being relocated closer to the main commercial area of the town and, in this case, to the site of the historic Windsor Locks station. The new station’s improvements include high platforms that are to be fully ADA accessible. The station will also serve a new privately financed mixed-use TOD project in the town, a development only occurring because of the station relocation project.114
Table 8. Percentage of ridership growth on the CTDOT Hartford Line in boardings and alightings, 2019–24.
| Location | Boardings and Alightings | % Growth from 2019 | TOD Project Completed Since 2015 | |
|---|---|---|---|---|
| 12 Months Through 9/30/2024 | ||||
| Meriden | 30,950 | 88,509 | 186 | ✓ |
| Berlin | 27,787 | 69,210 | 149 | ✓ |
| Windsor | 12,729 | 30,818 | 142 | ✓ |
| Windsor Locks | 19,394 | 39,983 | 106 | |
| Hartford | 213,093 | 428,570 | 101 | |
| Wallingford | 22,782 | 44,342 | 95 | |
| Springfield | 105,677 | 190,709 | 80 | |
| New Haven Union Station | 234,648 | 396,610 | 69 | |
| New Haven State Street | N/A | 91,105 | N/A | |
Source: Adapted from Hartford Line Station Ons and Offs, CTDOT, provided 2024.
In the future, CTDOT is interested in using state-owned land to develop TOD and use the development as a revenue source by leasing its land to developers.115
Ridership on the Hartford Line and New Haven Line Waterbury branch is above pre-pandemic levels, which CTDOT staff attributed to the increased development around stations.116 While the Hartford Line service began operation in 2018, and therefore did not have much of a pre-COVID base, its ridership growth is significantly higher at stations with completed TOD development nearby, as shown in Table 8.
The Hartford Line example shows a relationship between TOD and ridership that can develop on lines with commuter rail-like services and frequencies. While the Hartford Line service was launched in 2018 and all stations saw growth associated with increased frequencies, the stations with significant TOD completed since 2015 had the greatest amount of ridership growth. The initiatives at CTDOT demonstrate strategies for transportation agencies looking to find alternative uses for publicly owned land to replicate these ridership and revenue outcomes. However, TOD does not often happen organically. To achieve the desired outcomes, CTDOT created an intentional TOD strategy and a dedicated TOD position in the commissioner’s office to execute that strategy and manage local partnerships. Commuter rail providers wishing to grow their ridership base and offset operational costs can develop TOD strategies to the same end.


