The Future of Commuter Rail in North America (2025)
Chapter: 4 Commuter Rail Industry Parameters
CHAPTER 4
Commuter Rail Industry Parameters
When determining the future of commuter rail in North America, it is vital to understand the institutional and financial parameters of the services, defining their governance, costs, and funding streams. Outlined at a high level here, these parameters will help frame future options and demonstrate the opportunities for the future. The challenges are generalizations for the North American commuter rail industry, and the options for future services will vary depending on the agency, the network, and the region’s goals.
4.1 Institutional Considerations: Who Owns, Operates, and Funds Commuter Rail Services?
The first challenge for commuter rail lies within the institutions that deliver the service. Governance of the commuter rail systems affects the public policy strategy for current and future decision-making. Governance not only involves the board and funding sources, but also the ownership and control of the infrastructure on which the services run.
Across North America, commuter rail service is run by public agencies that plan, fund, and either operate directly or contract for the operations of the service (Nelson and O’Neil 2019). Their governance arrangements were designed for the commuter-focused services they provide. For example, few are well integrated into local transit services at stations in terms of scheduling, ticketing, or physical station connections. These factors pose an interagency and intermodal challenge to reducing barriers to using a combination of services. Table 4 outlines the key components of each commuter railway in the United States and its funding sources, operations, and infrastructure ownership.
The structure of an organization’s board and its funding sources are usually directly linked. For example, Trinity Railway Express (TRE), connecting Dallas and Fort Worth, is a commuter rail line completely funded by local governments, and the local agencies are responsible for making decisions about the service (Schank et al. 2015). The State of Texas has little, if any, input into TRE. The MARC system, on the other hand, is wholly funded, planned, and governed by the State of Maryland, and localities do not have any funding role and are not directly involved in governance. This dynamic can become a challenge, for example, when attempting to raise new revenues outside the existing governance structure. A state or local entity might not want to contribute new funds to an organization if it has no direct role in determining how those funds are used in the future.
In some cases, institutional barriers limit what can be done from a technical operating standpoint. For example, the commuter rail systems of MARC (Maryland) and VRE (Virginia) physically connect where they terminate at Washington Union Station. While some technical and infrastructure constraints exist in terms of rolling stock and terminal infrastructure, the
Table 4. Commuter rail systems in the United States, by governance structure.
| Agency | Board | Operational Subsidy Sourcea | Infrastructure Ownership | Operations |
|---|---|---|---|---|
| Altamont Corridor Express | Regional commission | Local, state | Freight host | Contracted |
| A-Train | County authority | Local | Agency | Contracted |
| Caltrain | Regional authority | Local, state | Agency | Contracted |
| Denver RTD | Regional authority | Local | Agency | Contracted, directly operated |
| EXO | Regional authority | Province, local | Freight host | Contracted |
| GO Transit | Regional authority | Province, local | Freight host, agency | Contracted |
| Long Island Rail Road | State authority | State, local | Agency, Amtrak (Penn Station) | Directly operated |
| MARC | State agency | State | Amtrak (Union Station), Freight host | Contracted |
| MBTA Commuter Rail | Division of state DOT | State, local | Agency | Contracted |
| Metra | Regional authority | State, local | Agency, freight host | Directly operated, contracted |
| Metrolink | Regional authority | Local, state | Agency, freight host | Contracted |
| Metro-North | State authority | State, local | Agency, CTDOT | Directly operated |
| NCTD Coaster | Regional authority | Local, state | Agency | Directly operated |
| New Jersey Transit | State agency | State | Agency, Amtrak, Freight host | Directly operated |
| Northstar | Regional authority | State, local | Freight host | Contracted |
| Rio Metro Regional Transit District | Regional authority | State, local | State DOT | Contracted |
| SEPTA | Regional authority | State, local | Agency, Amtrak, Freight host | Directly operated |
| Shore Line East | State agency | State | Amtrak | Contracted |
| SMART | Regional authority | State, local | Agency | Directly operated |
| Sounder | Regional authority | Local | Freight host | Contracted |
| South Shore Line | Regional authority | State, local | Agency | Directly operated |
| SunRail | State DOT | State | State | Contracted |
| TEXRail | Regional authority | Local | Freight host | Contracted |
| Trinity Railway Express | Regional authority | Local | Agency | Contracted |
| Tri-Rail | Regional authority | State, local | State DOT | Contracted |
| Utah Transit Authority | Regional authority | Local | Agency | Directly operated |
| Virginia Railway Express | Regional commission | Local, state | Amtrak (Union Station), Freight host | Contracted |
| WeGo Star | Regional authority | State, local | State DOT | Contracted |
| West Coast Express | Regional authority | Province, local | Freight host | Contracted |
a Operational subsidy sources are non-federal and do not include passenger revenues.
institutional barriers of combining the two networks remain immense. This is despite surveys showing that MARC passengers would like to access stations on the VRE network, and vice versa (COG 2020). Initiating through-running service would require agreements on schedules, slots, funding allocation, fare collection, labor agreements, equipment sharing, and coordinated planning of infrastructure. This is challenging when funding sources are not aligned, governing boards are separate, and major entities like Amtrak and the District of Columbia are not directly involved in governing the agencies.
Another institutional barrier applies to agencies that operate their service on host railroads, primarily those of privately held freight railroads. While most commuter rail providers operate on publicly held lines not shared with Amtrak, some service is on freight or Amtrak-owned rights-of-way (Allen and Newmark 2020). In those cases, the public transportation agencies need to ask for and pay the variable costs of track access to make any changes to their services, and the host railroads are frequently reluctant to give up capacity. Understanding the physical constraints of the network, and the costs associated with expanding those constraints, will be crucial to determining possible future operating patterns.
4.2 Financial Considerations: What Are Commuter Service Costs, and Who Pays?
Institutional considerations are closely related to financial ones. In 2023, the 25 U.S.-based commuter rail systems spent a combined $8.2 billion on operating expenses and another $5.8 billion on capital expenditures.25 These numbers represent a roughly 24 percent increase on pre-pandemic 2019 annual spending, paid through passenger fares and subsidies from state, local, and federal governments. Changing the operating model might require more vehicle revenue hours, more infrastructure, and costly new equipment. This section summarizes the kinds of costs involved in commuter rail operations, how they might change in the future, and where agencies might access new funding sources to adapt to future passenger demands.
The Costs of Commuter Rail
In North America, costs for transit systems, including commuter rail, come from two primary categories: operating costs and capital costs. These distinctions are important because they inform how public transportation agencies develop their budgets and because their classification determines whether they are eligible for certain federal, state, and local funding programs.
Operating costs are associated with the day-to-day operations of the system. These generally include but are not limited to
- Train Operations
- – Train and engine crew, including fare collection
- – Fuel or electricity for train operations
- – Station operations
- Maintenance of Equipment
- – Vehicle maintenance and cleaning
- Maintenance of Way
- – Track
- – Signals and communications
- – Bridges and buildings
- Administration and Management (Musick 2022)
For the three decades preceding the COVID-19 pandemic, commuter rail systems enjoyed great popularity with funding agencies because they covered a large fraction of their operating
costs with fare revenues. In 2019, fares covered, on average, 50 percent of all operating costs, with Caltrain having the highest farebox recovery ratio at 75 percent.26 For decades, this was seen as a strength, with commuter rail covering more of its operating cost on average than any other transit mode (Moore 2002).
Growing downtown employment at city cores and increasing congestion on highways into the cities allowed commuter railways to run competitive services that were generally faster and cheaper than driving for a significant portion of the market. Commuter rail’s farebox recovery ratio was high in part because it could charge higher fares for longer passenger trips compared with lower fares charged by local transit systems with much shorter passenger trip lengths.27
In 2023, fares covered only 25 percent of operational expenses on average across the commuter railroads in the United States.28 Reduced fare revenues from lower ridership combined with growing operational expenses pose a financial challenge for commuter rail.29
State and local subsidies covered the remaining operating costs for commuter rail services before 2020.30 The relative amount from state and local sources depends on the governance of the agencies. The MARC system, for example, is a division of the state DOT and receives its operating subsidies from the State of Maryland. TRE in the Dallas–Fort Worth region is locally run and receives all its subsidies from local governments within the region. Others have a mixture of state and local funds that can vary widely depending on the agency structure.
Figure 10 shows that since the COVID-19 pandemic, fare revenue has plummeted for most commuter rail providers, and, for most providers, revenue tracks closely with their ridership
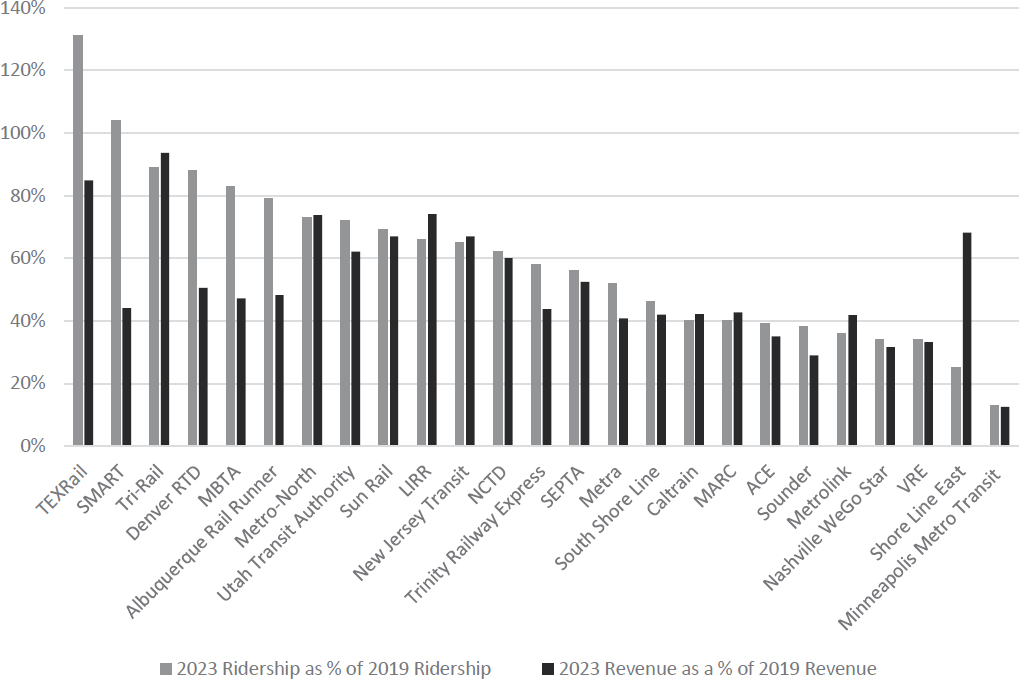
recovery. For example, Tri-Rail, in south Florida, brought in 94 percent of its 2019 fare revenue in 2023 and served 90 percent of its ridership over the same period. On average, the typical commuter railroad in 2023 collected about half (51 percent) as much passenger revenue as earned in 2019. However, for six systems (TEXRail, SMART, Denver RTD, MBTA, Albuquerque Rail Runner, and Shore Line East), the fare revenue recovery and ridership recovery seem completely independent. This could be attributed to several agencies (e.g., TEXRail, SMART, and Denver RTD) opening new segments and services during this time. In others, like Boston’s MBTA Commuter Rail, new regional service has attracted substantial new ridership, but many new riders might be paying less for shorter and cheaper trips.
Capital costs are associated with long-term investments. The U.S. DOT states that a capital expense is one that “adds to the productive capacity of the economy” and continues with more explicit examples for public transit services and infrastructure. These generally include but are not limited to
- Construction of new infrastructure such as tracks, stations, and support structures
- Major rehabilitation of infrastructure and rolling stock
- Procurement of new rolling stock
- Salaries and costs of project support staff and contracts for design and engineering31
Classification of expenses in many cases is straightforward but, in some cases, can be open to interpretation. For example, some significant maintenance expenses could be classified as either a capital rehabilitation expense or part of the operating maintenance expense.
Federal capital formula and discretionary funding complement local funds, with the federal government typically covering 25 to 50 percent of capital costs.32 The federal government, through the Capital Improvement Grant (CIG) discretionary grant program, helps to fund investments in transit, including commuter rail services. The CIG program funds expanded service or new lines, and the FTA also has programs to support new equipment acquisition.33
Commuter Rail Funding: What Are Future Funding Options?
In 2019, fares covered 50 percent of all commuter rail operating costs in the United States, with the remainder coming from state and local public subsidies. This funding paradigm for commuter rail existed for decades until 2020. With the collapse of the commuter market following the onset of the COVID-19 pandemic, fare revenues have dropped along with ridership, and revenues continue to remain depressed. In 2023, fares covered only 25 percent of all costs.34
To make up the shortfall for commuter rail operations and other transit operations in the United States, Congress passed three COVID-19 relief laws in March 2020, December 2020, and March 2021. This legislation allocated a total of $70 billion in funds for public transit operations in the United States.35 The intention of the funding was to cover operating shortfalls related to plummeting fare revenues and increasing operational costs and was the first time the federal government gave broad eligibility to fund major transit operations since the 1990s.36 Similarly, in Canada, the federal Safe Restart Agreement provided $2.3 billion in temporary transit operating funding in 2020 to help cover shortfalls (Government of Canada 2024b).
The U.S. Congress quickly created COVID-19 relief formulas to distribute funding to states and regions loosely based on need, giving an unequal distribution of funds with respect to the amount of time such funding covered gaps (Davis 2021). This left some commuter rail providers facing revenue shortfalls as soon as fiscal year 2023, while other (mostly small) agencies have funding available for operations until at least fiscal year 2028.37 Prospects for additional federal operating support remain slim in both the United States and Canada, leaving providers to seek additional local or state funding, cut costs, or both.
Alternative funding sources, such as paid advertising or value capture, remain limited on commuter rail systems in the United States (APTA 2015).
Past federal funding commitments for commuter rail services can place constraints on future operations. For example, a recent analysis of the Northstar commuter rail line in Minnesota found that depressed ridership has pushed the subsidy to $150 per passenger trip, as the service continues to operate with only 11 percent of its pre-COVID riders (Metropolitan Council 2023). While this is not financially or politically sustainable in the long run, shutting down might not be financially viable either. Most commuter rail systems have received federal funding for their development, which by law would have to be repaid if the service were to be abandoned. There may also be additional costs associated with the purchase-of-service agreements between the transit agency and the host railroad. The Metropolitan Council (2023) estimates it might need to repay the FTA between $10.6 and $161.9 million if it were to discontinue Northstar service. However, on February 26, 2025, the Minnesota DOT and the Twin Cities Metropolitan Council announced that the Northstar service would likely be discontinued and replaced with commuter buses.38
How Operating Models Affect Costs
How a commuter rail network is operated will greatly affect its operating and capital costs. In general, the more extensive a system, the more infrastructure and rolling stock it maintains. More and longer routes with more frequent trips also add to costs. However, sometimes different operating models yield different intensities of equipment use, infrastructure requirements, and staffing levels.
Traditional Operating Pattern
Take, for example, the operating pattern of a traditional commuter rail network. Figure 11 shows a simplified stringline diagram of a single-line commuter rail network with three stops. A stringline diagram is a time chart that illustrates the movement of trains between stations over time. The x-axis represents time, and the y-axis represents the distance each train has traveled along the infrastructure or corridor. For this example, most trains run inbound in the morning and return to suburban cities during the afternoon peak, with some off-peak and midday service. Some North American commuter rail lines follow this general operating pattern.39
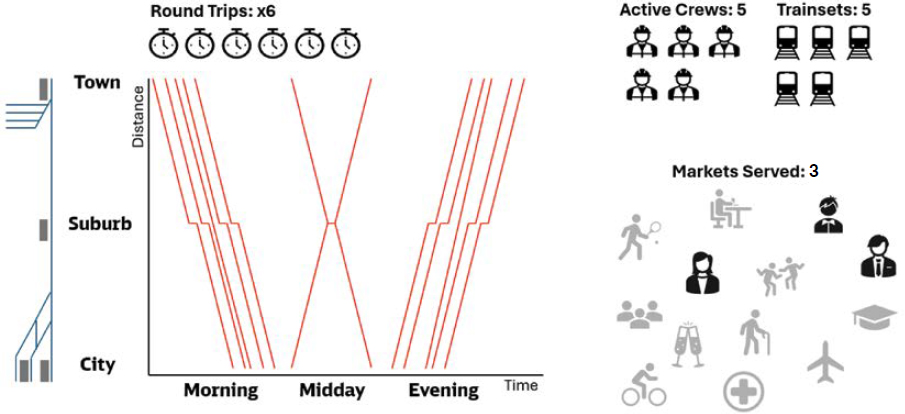
The example service in Figure 11 provides six total round trips. To operate the six round trips in the service requires five active crews, five trainsets, and capital infrastructure with significant storage yards at either end of the network to park the trains when they are not in use. This kind of service captures a significant portion of the downtown commute, but it is limited in its ability to attract riders for other trips.
All-Day Operating Pattern
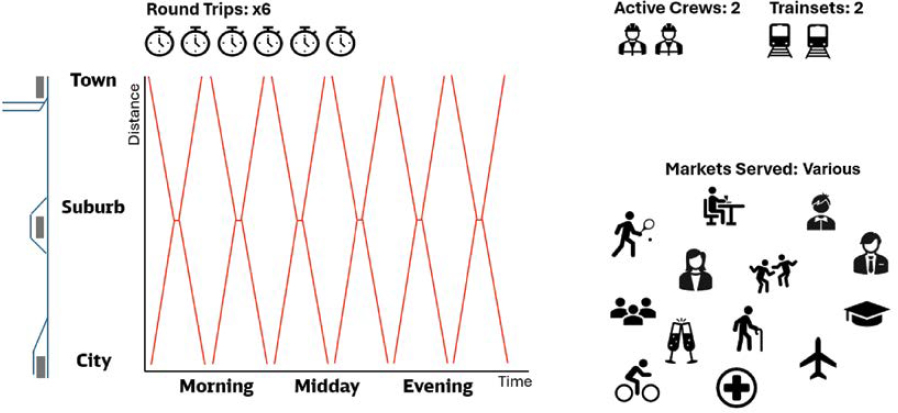
An alternative operating pattern provides regular, bi-directional, fixed-interval travel throughout the day. The service pattern example shown in Figure 12 has balanced, bi-hourly service with six round trips per day. From an operational standpoint, while this provides six round trips, it can be done with only two active crews and two trainsets. It also requires less physical infrastructure than a peak-oriented service pattern, with minimal double tracking and only two station platform tracks.
The service shown in Figure 12 can be more cost-efficient than the traditional commuter rail service shown in Figure 11, requiring significantly less infrastructure and fewer crews and trainsets, despite doubling the amount of service. However, it might not be less expensive on an absolute basis, accounting for more fuel consumption, equipment fueling and maintenance, and crew service hour limits and break requirements, as well as other factors that affect operational costs. Additionally, depending on the local market, this model may not best serve peak-period commuters who rely on the capacity and convenience of short headways during the commuting windows.
The simplified operating patterns in Figures 11 and 12 are for illustration; each railroad would need to evaluate its timetables within its own context, including when and how to add additional frequencies. In many cases with balanced regional rail, providers add additional trains during the peak, sometimes with express patterns, to add capacity and increase service if the demand is higher during that time.
This pattern also allows the commuter rail service to attract riders from many different markets, including leisure trips, business meetings, health care appointments, education, and other trips that are not typical downtown commutes. However, it also comes with challenges in the North American context, including capacity constraints throughout the day on tracks owned by host railroads. These considerations need to be balanced when planning future services.
Regardless, if balanced regional rail service is planned and executed correctly, it can result in lower unit (train–hour) operational costs and infrastructure requirements at the downtown terminal station because long station layovers are not needed for crew and equipment. Table 5 examines operational costs per revenue hour of service for the 25 commuter rail systems operating in the United States and shows that legacy systems and newer systems that provide all-day service have lower average costs than those that are peak oriented. While many legacy systems are peak oriented, many offer service during the off-peak. This supports the concept that all-day service improves resource efficiency, particularly equipment and crew utilization. However, further analysis at the agency level is necessary to fully understand unit costs and individual contexts of individual operators.
Table 5 deserves several caveats, as some commuter rail systems have multiple lines with different operating patterns (e.g., Metra). The table includes the averages of the respective systems because their costs are variable, perhaps because of differing operating agreements or accounting practices. As of 2022, costs have increased for most commuter rail providers because of factors such as inflation, while others, such as the Northstar service, have increased dramatically, in part because the service was cut from 12 trips per day to 4.40
Available Funding Opportunities
Fundamental to the future of commuter rail will be the funding available for alternative operations and capital investments in networks. U.S. commuter rail systems are eligible for federal funding under the FTA. Since the 1990s, the FTA has almost exclusively given grants to public transportation agencies and commuter rail providers for capital expenses instead of operating expenses. For example, the FTA distributes approximately $4.2 billion annually to urban transit systems under the State of Good Repair Grants Program (49 U.S.C. 5337), providing capital assistance for maintenance, replacement, and rehabilitation of equipment and infrastructure.
An exception to the capital-focused nature of federal financial support was COVID-19 relief funds, which were available to fund any transit expense. Most commuter rail providers used this support for operating expenses. Similarly, in Canada, federal funds are available for capital projects on a regular basis, and the new Canada Public Transit Fund provides a baseline of formula support with discretionary grants targeted to larger projects (Government of Canada 2024a).
Despite having safety regulated by the FRA, commuter rail providers are generally not eligible to apply directly for FRA grants. However, these agencies can partner with entities eligible for FRA grants, including states, groups of states, other public agencies, Amtrak, and other freight rail carriers, which provide intercity passenger transportation services to receive FRA funding. However, planning grants, such as the Corridor ID Program and capital grants for intercity
Table 5. Operating expenditure per revenue hour by commuter rail system type, 2019.
| Commuter Rail System Type | 2019 Operating Expenses per Revenue Hour |
|---|---|
| Legacy | $569 |
| New—all day | $680 |
| New—peak only | $856 |
Note: Operating expenditure is the average of all systems as classified in Section 1.1 of this report.
Source: Adapted from National Transit Database, 2024.
passenger rail like the Federal–State Partnership, both administered by the FRA, are not intended for the types of services provided by commuter rail providers.
The FTA received a significant boost in capital funding availability from the 2021 Infrastructure Investment and Jobs Act. Commuter rail is eligible to apply for grants for several FTA programs, including those targeted to equipment modernization, Capital Investment Grants, accessibility grants, and others targeted at improving the state of good repair. This law and its funding expire in 2026, and it is unclear how Congress will approach its reauthorization.
However, although in some cases a redesigned service might be less expensive to operate on a per-mile basis, paying for major changes to infrastructure or upgrading equipment might require new sources of funding. Asking the public for more investment while ridership remains depressed poses a large challenge for those requests.
In planning for the future of commuter rail, states, regions, and commuter rail providers need to understand the constraints regarding what they can and cannot control. While it might be difficult, states and regions can address the governance of their commuter railroads, help establish new funding resources, and enable changes to their operational patterns. However, broader public policies, such as creating return-to-office mandates or limiting auto ownership, are beyond their control. Considering what the industry can practically implement will be crucial to shaping the future of commuter rail services in North America.


