Review of Evidence on Alcohol and Health (2025)
Chapter: 4 Weight Change Related to Alcohol Intake
4
Weight Change Related to Alcohol Intake
The incidence of overweight and obesity (Table 4-1) in the United States has steadily increased since the 1970s. This ‘obesity epidemic’ occurs in many high-income countries and more recently has been documented in many medium- and low-income countries. Based on 2017–2018 National Health and Nutrition Examination Survey (NHANES) data, 30.7 percent of adult men and women in the United States meet the criteria for overweight and 42.4 percent have obesity (Fryar et al., 2021).
In 2022, multiple organizations that focus on obesity, including its research, treatment, and prevention, created a consensus statement, indicating:
Obesity is a highly prevalent chronic disease characterized by excessive fat accumulation or distribution that presents a risk to health and requires lifelong care. Virtually every system in the body is affected by obesity. Major chronic diseases associated with obesity include diabetes, heart disease, and cancer. (GWU, n.d.)
The importance of obesity as a risk factor for adverse health outcome emerges from multiple studies showing that it is an independent risk factor for chronic health conditions including dyslipidemia, hypertension, cardiovascular disease, diabetes, cancer, and arthritis, among others, and can be associated with sociological and psychological harms (Dettoni et al., 2023; Keramat et al., 2021; Pi-Sunyer, 2009).
CHOICE OF OUTCOMES
Although the Statement of Task instructed the committee to consider the association between alcohol consumption and growth, size, body composition, and risk of overweight and obesity, adults do not experience ‘growth’ in height; therefore, the committee focused on the remaining outcomes specified in the Statement of Task. Growth, size, body composition, and overweight or obesity risk are related but distinct outcomes. ‘Size’ refers to overall body dimensions, most commonly height and weight, but also includes waist circumference (WC) and various anthropometric ratios. The committee focused on three body size measurements in literature searches: body weight, body mass index (BMI), and WC. Additionally, preliminary evidence scans identified only a few articles reporting body composition; therefore, the systematic review literature search focused on the following outcomes: weight, BMI, overweight and/or obesity risk, and WC. Other weight-related outcomes that were not selected as primary outcomes but were also reported in the included studies (waist-to-hip ratio, body composition) were extracted and presented as systematic reviews with narrative synthesis. Below, the committee discusses the strengths and limitations of selected outcomes.
Body Weight (Body Mass)
The first outcome selected to reflect body size is body weight. Body weight is a measure of an individual’s body mass, typically expressed in pounds (lb) or kilograms (kg). In clinical and research settings, body weight is usually measured using a calibrated scale; however, body weight may also be self-reported. Body weight can be a useful outcome to track over time to examine trends and the effects of interventions.
While an important dimension of body size, body weight alone is insufficient to assess excess adiposity and the risk of overweight or obesity because body weight is highly associated with height and does not distinguish between lean and fat mass. Body weight also varies throughout the day, and there are significant limitations to relying on self-reported body weight, as discussed below.
Body Mass Index
Another outcome selected to reflect body size is BMI, which is defined as body weight in kilograms divided by height in meters squared (kg/m2). BMI does not measure body fat directly but is associated with body fat, and there are associations between BMI and excess adiposity having a stronger association as BMI increases. However, BMI is most useful as an outcome
when applied on a population basis—that is, assessing many people in a public health context (Cuevas and Willett, 2024).
At the individual level, BMI has limited usefulness because it does not take into consideration body composition. There are also questions regarding its interpretation with respect to different heights, frame types, and ancestries/ethnicities (Bajaj et al., 2024; Council on Science and Public Health, 2024) as well as age and sex, particularly in those with a BMI of less than 30 kg/m2 (Frankenfield et al., 2001; Holt et al., 2023). Thus, the consensus statement also points out the following:
The [BMI] is used to screen for obesity, but it does not displace clinical judgement. BMI is not a measure of body fat. Social determinants, race, ethnicity, and age may modify the risk associated with a given BMI. (GWU, n.d.)
Increases in BMI are primarily related to accrual of adipose tissue, whereas decreases are commonly associated with a loss of fat free mass or lean body mass as well as adipose tissue. Some of this loss in lean tissue may be mitigated by increased protein intake and/or physical activity. While increased BMI is recognized as a risk factor for metabolic dysfunction, the loss of lean tissue, particularly muscle mass or strength, is also a risk factor for cardiovascular disease (Zuo et al., 2023).
Despite these caveats, BMI is widely used and has been demonstrated to be associated with adiposity in population-based studies. Although BMI is not as granular an assessment as body composition, for large-scale observational studies, weight and height measures are reproducible when performed in a systematic manner using a calibrated scale and stadiometer and provide far more useful information than does body weight alone. Height and weight can be measured in both research and clinical settings in large numbers of individuals, and BMI is a standard component of medical records.
Although methods to estimate body composition exist, given the cost, equipment required, and time necessary to perform these measures, studies included in this chapter defined overweight and obesity using BMI because it is regularly used in large prospective cohort studies and requires minimal equipment and training; nearly all the publications reviewed here used it as a primary outcome measure.
Overweight or Obesity Classification by BMI Criteria
The most common approach to classifying people as being overweight or obese is to use BMI categories. Table 4-1 presents the most recent categories from the Centers for Disease Control and Prevention (CDC, 2024), and the categories modified for those of Asian/Pacific Islander ancestry (WHO Expert Consultation, 2004). It has been suggested that categories specific
| Class | BMI categories (kg/m2) CDC | WHO Asia and Pacific Islander ancestry |
|---|---|---|
| Underweight | <18.5 | <18.5 |
| Normal weight | 18.5–24.9 | 18.5–22.9 |
| Overweight | 25–29.9 | 23–24.9 |
| Obesity | ≥30 | ≥25 |
| Class I | 30–34.9 | N/A |
| Class II | 35–39.9 | N/A |
| Class III | ≥40 | N/A |
NOTES: BMI = body mass index; CDC = Centers for Disease Control and Prevention; kg = kilogram; m = meter; N/A = not applicable; WHO = World Health Organization.
SOURCES: CDC, 2024; WHO Expert Consultation, 2004.
to other racial or ethnic groups should be developed. In an example using NHANES data, BMI values that were associated with comorbidities differed among men and women identifying as Black, Hispanic, or White (Stanford et al., 2019). At present, however, such categories are not commonly used, and the studies included in this chapter do not employ such methods.
Although dividing continuous variables such as BMI into categories may be clinically useful for ease of decision making, it raises challenges in research due to risk for misclassification. As an example, there are people in the 18.5–24.9 kg/m2 BMI range—normal or healthy weight—who may have excess adiposity due to a lighter body frame (Sweatt et al., 2024); whereas some people with a BMI greater than or equal to 30 kg/m2 (obesity) have high lean mass relative to their adiposity (Sweatt et al., 2024). However, as an individual’s excess adiposity increases, the likelihood of classifying an individual as having excess adiposity by using BMI improves. Conversely, the usefulness of BMI for predicting negative health outcomes such as mortality similarly varies along the continuum of BMI and is particularly inconsistent in the 25.0–29.9 kg/m2 range (classified as overweight) (Flegal et al., 2018). Pooling overweight and obesity categories together may therefore be inappropriate.
Waist Circumference
A third outcome selected to reflect body size is WC. WC is an external measurement (Borgeson et al., 2024) that improves upon BMI by capturing regional body composition, including body fat distribution. Abdominal
adiposity, particularly visceral fat, is a stronger marker for adverse health outcomes (Sweatt et al., 2024). WC measurement (cm) is performed using a flexible, inelastic measuring tape and is obtained at the iliac crest (National Institutes of Health [NIH] guidelines) or the midpoint between the last rib and iliac crest (World Health Organization [WHO] guidelines) (Ross et al., 2020). A 2020 International Atherosclerosis Society and International Chair on Cardiometabolic Risk Consensus Statement concluded that WC thresholds used to define high risk of future coronary artery events vary by ethnicity and weight category defined by BMI; for example, thresholds differ for White women of normal weight and Asian Indian women (>80 cm) and White men of normal weight and Asian Indian men (>90 cm) (Ross et al., 2020). There is a general lack of consensus among organizations including WHO and NIH regarding specific thresholds, though NHANES data and the National Cholesterol Education Program suggest >88 cm for women and >102 cm for men (Janssen et al., 2022; WHO, 2008). Waist-to-hip ratio (WHR) includes the same WC measurement (cm) divided by hip circumference (cm) to reflect upper versus lower body fat accumulation (Ross et al., 2020). Hip circumference is measured at the level of the largest lateral extension of the hips (WHO guidelines) (Jaeschke et al., 2015). Similar to WC, WHO provides guidance on WHR thresholds and suggests >0.90 for men and >0.85 for women correspond to substantially increased risk of metabolic complications (WHO, 2008).
Both WC and WHR measurements can be difficult to replicate in individuals with obesity, and two persons are often required to accurately take measurements. WC or WHR have stronger predictive values for health than weight or BMI alone and are a diagnostic component of metabolic syndrome. WC measures need only a tape measure to measure accurately (Borgeson et al., 2024; Nevill et al., 2022), yet they are seldom collected.
Body Composition
Body composition refers to defining the body by components, such as disaggregating the body based on molecules (i.e., minerals, proteins, lipids, and water) or tissues (e.g., skeletal muscle, adipose tissue, bone, blood, and other) (Wang et al., 1992). Terms describing components of body composition such as fat mass versus adipose mass may sound similar but are not necessarily equivalent: here, fat is used to refer to lipids, whereas adipose represents cells or tissues. These distinctions have potential implications for interpreting clinical relevance of changes in body composition in different compartments (Conte et al., 2024). Associations between BMI and general adiposity or fat mass were described above, as were associations between WC with central or visceral adiposity, but BMI and WC are not direct measures of body fat or adiposity.
There are various methods used to assess body composition including densitometry (using either air or water), total body water, total body potassium, dual-energy X-ray absorptiometry, and anthropometry. Because these methods are only estimates of true body composition, there are no universal reference standards and various methodologies provide different values (Fields et al., 2002; Kelly et al., 2009; Xiao et al., 2018). Factors such as age, sex, and ethnicity provide an additional source of variation using the same methodology. Lastly, updated versions of measurement devices may provide different estimates of body composition due to updates to the software used in a device (Barbour et al., 2016).
One method for estimating lean and fat mass is bioelectrical impedance analysis (BIA), which involves passing a weak current through the body. It is rapid, noninvasive, and provides better estimates of lean and fat mass than BMI (Borgeson et al., 2024). However, it has lower within-individual reproducibility and lower accuracy in persons as level of obesity increases. Acute eating and drinking can modestly affect BIA estimates (Androutsos et al., 2015), and protocols for BIA measurement include avoiding practices that may acutely alter hydration status, such as vigorous exercise or caffeine and alcohol consumption (Ritchie et al., 2005). Although other approaches for body composition estimation are available with different strengths and limitations, BIA is the only method used in any studies included in this chapter.
BIOLOGICAL PLAUSIBILITY
Alcohol consumption may directly and indirectly lead to changes in weight, body composition, and BMI by providing energy and by affecting metabolism, appetite, and satiety. Moderate alcohol consumption may have differential effects on weight and adiposity relative to biological sex, age, physical activity level, and other individual-level factors (Traversy and Chaput, 2015). Genetics also contribute to the heterogenous pathophysiological responses to alcohol intake (Suter et al., 1997). This chapter evaluates the associations between moderate alcohol consumption and the weight-related outcomes described above.
Energy and Metabolism
Alcoholic beverages primarily contain water, alcohol (ethanol), and carbohydrates, along with various congeners. Alcohol provides approximately 7 kilocalories per gram (kcal/gram) of metabolizable energy (Lieber, 2003). Total energy and nutrient content vary significantly by alcoholic beverage type (e.g., beer, wine, spirits, mixed drinks). Moderate alcohol consumption also affects the central pathways of energy metabolism and
the absorption of nutrients including glucose, glutamine, iron, and calcium (Butts et al., 2023). Ethanol is preferentially oxidized over fat and carbohydrates (Ferdouse and Clugston, 2022; Sayon-Orea et al., 2011a) to generate acetate, which either enters the tricarboxylic acid cycle for energy or is used for ketone and fatty acid synthesis. Alcohol acutely reduces lipid oxidation through direct interaction with the mitochondria, accompanied by a commensurate increase in de novo lipogenesis (Lu and George, 2024). It also depresses insulin signaling and may drive a partial insulin resistant state (Tatsumi et al., 2018). These metabolic effects can result in hepatic steatosis and the accumulation of excess adipose tissue (Suter et al., 1992), including in abdominal fat, which is associated with an increased risk of cardiovascular disease, metabolic syndrome, and other adverse health effects (Cigolini et al., 1996; Suter et al., 1997). However, to what extent these outcomes apply to moderate alcohol consumption remain unclear.
Alcohol is proinflammatory (Gonzalez-Reimers, 2014), and obesity is also recognized as an inflammatory disease (Wu and Ballantyne, 2020). Alcohol’s inflammatory actions are driven by increases in gut permeability that facilitate the entry of microbial-derived products that promote hepatic Kupffer cell activation and cytokine production. These products, combined with repeated alcohol exposures, act in a feed-forward loop to further promote a proinflammatory state (Wang et al., 2010). To what extent these proinflammatory processes are stimulated by moderate alcohol consumption is an open question. Obesity is also considered a metabolic inflammatory state characterized by chronic, low-grade inflammation resulting from excess energy intake. There are some indications that this state of “meta-inflammation” contributes to metabolic dysfunction (Wu and Ballantyne, 2020).
Energy Balance and Ingestive Behavior
Long-term alcohol consumption without a corresponding reduction in energy intake from other foods and beverages or increased energy expenditure can lead to a chronic imbalance in energy, as is true of any other energy-containing food or beverage (Gunzerath et al., 2004). CDC reports that, based on NHANES 2007–2010 data, adults in the United States consume an average of nearly 100 kcal/day from alcoholic beverages. Men tend to consume more energy (calories) from alcoholic beverages than women (150 kcal/day versus 50 kcal/day on average) (CDC, 2012). Indeed, in moderate consumers, alcohol is often an additional source of energy, rather than displacing other energy sources (Suter, 2005). A positive energy balance that may result from moderate alcohol consumption could lead to accrual of adipose tissue over time, thus increasing the risk of obesity.
In addition to directly serving as a source of energy that may result in chronic positive energy balance over time, moderate alcohol intake has also been reported to stimulate appetite and cravings, particularly before a meal, a phenomenon known as the aperitif effect. Studies suggest that alcohol-containing beverages, but not necessarily other beverages, result in greater 24-hour energy intake (Westerterp-Plantenga and Verwegen, 1999), yet the effects do not necessarily persist in subsequent days (Caton et al., 2007). Directly elevating blood alcohol concentrations by intravenous means leads to activation of brain regions associated with food intake, thus circumventing potential social modifiers. This is accompanied by significantly greater levels of energy intake even under moderate blood alcohol concentrations with concomitant reductions in ghrelin, a hormone associated with food intake (Eiler et al., 2015). Indeed, an extensive literature has documented that many of the same neuropeptide signals modulating food intake also participate in responses to alcohol consumption with respect to intake: reward and craving (Barson and Leibowitz, 2016). Together, these studies provide mechanistic plausibility for ethanol causing acute changes in energy intake.
PRIOR DGA RECOMMENDATIONS
With respect to moderate drinking, the 2010 DGAC concluded, “Moderate evidence suggests that among free-living populations, moderate drinking is not associated with weight gain.” This conclusion statement was based on a systematic review of literature published between November 1994 and May 2009 and included eight studies, one randomized controlled trial and seven prospective observational studies investigating weight and WC. The 2015 and 2020 DGACs did not examine associations between moderate alcohol consumption and weight-related outcomes. Therefore, this systematic review includes literature published between January 2010 and February 2024.
METHODOLOGICAL CONSIDERATIONS
In addition to limitations noted above for each outcome considered in this systematic review, body size measures, such as body mass and height, are sometimes self-reported. Self-reported height and weight have systematic and idiosyncratic issues that make them unreliable for assessing obesity (Flegal et al., 2018). The issue is compounded when the self-reported estimates are used to estimate BMI, which exacerbates misclassification errors in categorizing BMI categories. Different groups, including race, sex, and age, may differentially over- or under-report height and weight, making systematic corrections of BMI difficult (Banack et al., 2024; Flegal et al., 2018). Some measurement error correction techniques exist to correct self-reported
BMI (Banack et al., 2024), but the approaches do not necessarily correct the measurement error and may introduce new or different errors (Flegal et al., 2021). Conclusions based on self-reported height, weight, BMI, and obesity status should therefore be interpreted with caution.
Although self-reported consumption of alcohol is generally problematic for all the outcomes evaluated in this report, self-reported energy consumption has been identified as an invalid estimate of actual energy intake (Dhurandhar et al., 2015). Therefore, it is difficult to assess the contribution of alcohol-derived energy (calories) intake either in isolation or as a proportion of total energy, given the general challenges with reporting of alcohol intake and the specific challenges with self-reported energy intake in the context of obesity. Despite the limitations of self-reported energy consumption collected at the individual-level through methods such as 24-hour recalls, diet histories, and food frequency questionnaires, there are few validated methods that accurately measure the intake of specific nutrients. Therefore, large population-based studies continue to use self-report methods, necessitating interpretation with caution.
SYSTEMATIC REVIEW
Approach
As described in Chapter 2, databases were searched from January 2010 through February 2024 to identify articles eligible for inclusion in this systematic review. The full search strategy can be found in Appendix F. Separately, recent systematic reviews on this topic were hand searched for referenced articles that may have been missed by the database searches.
There were 4,843 unique articles identified in the database searches. The full texts of 64 articles were reviewed, and seven cohort studies were identified that met the committee’s eligibility criteria and are included in this systematic review (Figure 4-1). Reasons for exclusion of studies are listed in Appendix F.
The committee focused its review on moderate alcohol consumption as defined by the DGA (≤1 drink/day for women and ≤2 drinks/day for men); a standard drink was defined as the equivalent of 14 grams of alcohol. Alcohol consumption data from individual studies were harmonized to the moderate criteria and expressed as drinks/day, as fully described in Chapter 2. None of the seven cohort studies differentiated between never drinkers and former drinkers, thus comparisons to abstainers and nondrinkers were not considered when developing conclusions to avoid abstainer bias. Therefore, all results considered in developing final conclusions compared alcohol consumption among those that consumed moderate amounts of alcohol separately in men and women when data were provided by the authors.
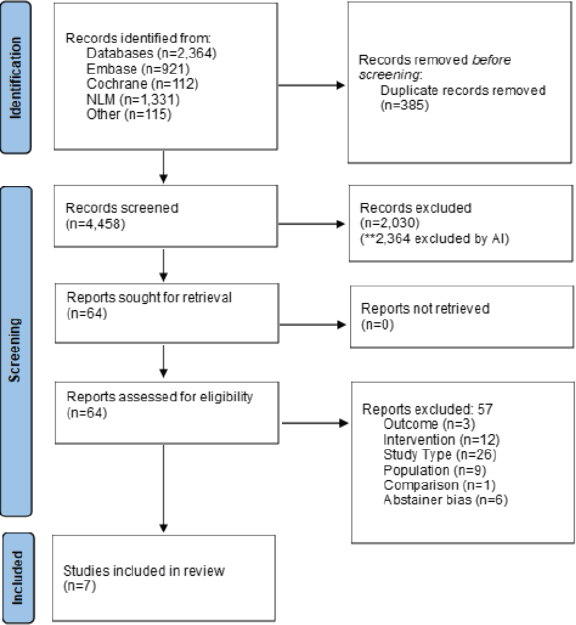
NOTES: The diagram shows the number of primary articles identified from the primary article and systematic review search and each step of screening. The literature dates include articles with publications between 2010 and 2024. n = number; NLM = National Library of Medicine, PRISMA = Preferred Reporting Items for Systematic Reviews and Meta-Analyses.
SOURCE: Figure F-1 in Appendix F, Academy of Nutrition and Dietetics, 2024.
Meta-analysis was not pursued for the seven studies due to heterogeneity in population, exposure, comparator, outcome, and design. Therefore, the studies are described narratively and summarized in a GRADE table (Table 4-2). The GRADE table was created to reflect the Academy of Nutrition and Dietetics’ systematic review results that included all alcohol consumption intake levels rather than the committee’s focus on comparisons among moderate alcohol consumption. Most studies adjusted for confounding variables such as age, smoking, diet, physical activity, and comorbidities (AND, 2024).
| Certainty Assessment | ||||||
|---|---|---|---|---|---|---|
| Participants (Studies) | Risk of Bias | Inconsistency | Indirectness | Imprecision | Publication Bias | Overall Certainty of Evidence |
| Weight (kg) Among Consumers | ||||||
| 35,140 (2 studies)g | seriousa | not serious | not serious | seriousb,c | none | veryf low |
| Body Mass Index Alcohol Consumption vs. Never Consuming | ||||||
| 4,355 (1 study)h | seriousa | not serious | not serious | seriousb,d | none | veryf low |
| Body Mass Index Among Consumers | ||||||
| 33,419 (1 study)i | seriousa | not serious | not serious | seriousb,d | none | veryf low |
| Waist Circumference Alcohol Consumption vs. Never Consuming | ||||||
| 4,355 (1 study)h | seriousa | not serious | not serious | seriousb | none | veryf low |
| Waist Circumference Among Consumers | ||||||
| 74,787 (2 studies)j | seriousa | not serious | not serious | seriousb | none | low |
| Risk of Overweight and Obesity Among Consumers | ||||||
| 165,919 (3 studies)k | seriousa | seriouse | not serious | seriousb | none | veryf low |
a Some concerns.
b No pooled effect size.
c No quantitative data reported.
d One included study.
e Inconsistency between study results.
f The committee used the phrase “insufficient evidence” to reflect a lower level of certainty of the evidence, as indicated by the assignment of “very low” in the commissioned systematic reviews by Academy of Nutrition and Dietetics.
g Thomson et al., 2012; Wang et al., 2010
j Choi et al., 2019; Inan-Eroglu et al., 2022.
k Inan-Eroglu et al., 2022; Sayon-Orea et al., 2011b; Seki et al., 2021.
SOURCE: Adapted from Table F-4 in Appendix F, Academy of Nutrition and Dietetics, 2024.
Results
Of the seven studies, six were prospective cohort studies (Butler et al., 2023; Choi et al., 2019; Inan-Eroglu et al., 2022; Sayon-Orea et al., 2011b; Thomson et al., 2012; Wang et al., 2010) and one was a retrospective cohort study (Seki et al., 2021). Three examined associations between moderate alcohol consumption and weight (Sayon-Orea et al., 2011b; Thomson et al., 2012; Wang et al., 2010), two examined associations between moderate alcohol consumption and BMI (Butler et al., 2023; Inan-Eroglu et al., 2022), five examined associations between moderate alcohol consumption and risk of overweight/obesity (Inan Eroglu et al., 2022; Sayon-Orea et al., 2011b; Seki et al., 2021; Thomson et al., 2012; Wang et al., 2010), and four examined associations between moderate alcohol consumption and WC (Butler et al., 2023; Choi et al., 2019; Inan-Eroglu et al., 2022; Seki et al., 2021). Additionally, one included article (Inan-Eroglu et al., 2022) presented results relevant to the Statement of Task (WHR and body fat percentage); these results are presented descriptively.
Two of the seven studies had low risk of bias (Sayon-Orea et al., 2011b; Thomson et al., 2012), and five studies had some concerns (Butler et al., 2023; Choi et al., 2019; Inan-Eroglu et al., 2022; Seki et al., 2021; Wang et al., 2010) (Table 4-3). Risk of bias was primarily due to measurement of alcohol consumption and attrition.
Butler et al. (2023) (moderate risk of bias) evaluated associations between 5-year changes in alcohol intake and 5-year changes in WC and BMI in the Coronary Artery Risk Development in Young Adults (CARDIA) study. The analysis included 4,355 men and women between 18 and 30 years of age at baseline and followed up at 5-year intervals over 25 years
| Study | Bias domains assessed as “some concerns” or “high” | Overall risk of bias |
|---|---|---|
| Butler et al., 2023 | Confounding | Some concerns |
| Choi et al., 2019 | Confounding | Some concerns |
| Inan-Eroglu et al., 2022 | Missing data | Some concerns |
| Sayon-Orea et al., 2011b | All domains low risk of bias | Low |
| Seki et al., 2021 | Confounding, missing data | Some concerns |
| Thomson et al., 2012 | All domains low risk of bias | Low |
| Wang et al., 2010 | Exposure measurement, missing data | Some concerns |
SOURCES: CDC, 2024; WHO Expert Consultation, 2004.
to 2010–2011 (ages 43 to 55 years). Height, weight, and WC were measured during study exams using standardized protocols. Alcohol consumption was measured using the CARDIA Alcohol Use Questionnaire and was defined as nondrinker, light, moderate, or excessive (0, 0–4, 4–7, >7 drinks per week for women and 0, 0–7, 7–14, >14 drinks per week for men, respectively). Given that nondrinkers may have included former drinkers (i.e., risk of abstainer bias), only comparisons between light and moderate alcohol consumption fit the charge of this report. The authors compared changes or stability in alcohol consumption in multiple ways, including starting, stopping, increasing, decreasing, or stable intake. The committee considered “stable light/moderate” alcohol consumption versus “stop light/moderate” alcohol consumption as informative for the task. Shown in Table 4-4, in comparing point estimates and confidence intervals, changes in WC and BMI are similar among men and women who stopped light/moderate and those who maintained stable light/moderate alcohol consumption.
Choi et al. (2019) (moderate risk of bias) conducted a prospective cohort study that investigated associations between changes in alcohol consumption over 9–10 years (2004–2013) with WC from the Health Examinees-GEM study, which included 41,368 male and female participants. WC was measured during study health examinations, and alcohol
| Drinking Quantity Category | N | Reported Data |
|---|---|---|
| Waist Circumference | 40,696 | β (95% CI) |
| Women Stable Moderate (0> to <0.6 drinks/day) | NR | −0.55 [−1.05, −0.04] |
| Women Stop Moderate (0> to <0.6 drinks/day) | NR | −0.50 [−1.01, 0.01] |
| Men Stable Moderate (>0 to <1 drink/day) | NR | −0.24 [−0.7, 0.22] |
| Men Stop Moderate (>0 to <1 drink/day) | NR | −0.04 [−0.57, 0.48] |
| BMI | 40,696 | β (95% CI) |
| Women Stable Moderate (0> to <0.6 drinks/day) | NR | −0.20 [−0.4, 0.02] |
| Women Stop Moderate (0> to <0.6 drinks/day) | NR | −0.16 [−0.38, 0.06] |
| Men Stable Moderate (>0 to <1 drink/day) | NR | −0.10 [−0.26, 0.06] |
| Men Stop Moderate (>0 to <1 drink/day) | NR | 0.00 [−0.18, 0.18] |
NOTES: Only groups or comparisons that met inclusion criteria are reported here. BMI = body mass index; CARDIA = Coronary Artery Risk Development in Young Adults Study; CI = confidence interval; N = number; NR = not reported.
SOURCES: Adapted from Tables F-6 and F-8 in Appendix F, Academy of Nutrition and Dietetics, 2024; Butler et al., 2023.
consumption was assessed via self-reported questionnaire. Alcohol consumption was defined as nondrinkers, light, moderate, and heavy separately for men and women (0, >0–1.42, 1.43–2.85, and greater than 2.85 drinks/day for men and 0, >0–0.71, 0.71–1.42, and greater than 1.43 drinks/day for women, respectively). Drink estimates were converted from grams/day to drinks/day using 14 grams per drink. The nondrinkers group did not clearly exclude former drinkers (i.e., risk of abstainer bias), and the study authors’ definition of moderate slightly exceeds the moderate thresholds. With that limitation, the comparison of use to the present report is transitioning from light to moderate or moderate to light alcohol consumption. The authors pooled WC results across sexes and noted a small (~0.5 cm) statistically significant (p < 0.01) relative increase in WC for individuals who increased from light to moderate alcohol consumption; conversely, decreasing from moderate to light consumption was associated with a small (~0.1 cm) statistically significant decrease (p < 0.05) in WC. In conclusion, increasing alcohol consumption from light to moderate may be associated with a small but statistically significant increase in WC, while decreasing alcohol consumption from moderate to light may be associated with a small but statistically significant decrease in WC.
Inan-Eroglu et al. (2022) (moderate risk of bias) examined associations between baseline alcohol consumption and various measures of adiposity (BMI, body fat percentage [BF%]), WHR, WC, and incidence of overweight and obesity) at follow-up among 45,399 participants in the UK Biobank cohort, a large, population-based prospective cohort study that enrolled people 40–79 years of age between 2006 and 2010 with followup through 2018. Anthropometric measures were performed at baseline and follow-up using standard criteria, and BF% was estimated using BIA. Baseline alcohol consumption was assessed via self-administered questionnaire and categorized according to UK units of alcohol consumption (10 mL/unit), then converted to U.S. criteria for moderate alcohol consumption (Table 4-5). Since “non-current drinkers” included both never and former alcohol consumers, comparisons to this group were not considered in this report; the committee considered comparisons between quartiles 1, 2, and 3, which are close to moderate levels of alcohol consumption for men and women only.
Shown in Table 4-6, among men, mean differences in BMI and WC were similar in quartiles 2 or 3 compared to 1. Additionally, men in quartiles 2 and 3 had similar risk of overweight or obesity compared to men in quartile 1 (Table 4-6). Women in quartiles 2 and 3, however, had lower mean difference in BMI and WC (Table 4-5). In addition, women in quartile 2 had lower WHR (β = −0.006, 95%CI [−0.01, −0.001]) and women in quartile 3 had lower mean difference in BF% (β = −0.26, 95%CI [−0.49, −0.02]) compared to quartile 1. Shown in Table 4-6, women in quartiles 2
TABLE 4-5 Changes in BMI and Waist Circumference by Moderate Alcohol Consumption Category in Men and Women Enrolled in the UK Biobank Studya
| Drinking Quantity Category | N | Reported Data |
|---|---|---|
| BMI | 40,517 | β (95% CI) |
| Women ≤0.10 drinks/day (Q1) | 5,009 | Ref [0] |
| Women <0.56 drinks/day (Q2) | 4,841 | −0.12 [−0.23, −0.02] |
| Women <1.15 drinks/day (Q3) | 5,994 | −0.17 [−0.27, −0.07] |
| Men ≤0.52 drinks/day (Q1) | 4,712 | Ref [0] |
| Men <1.28 drinks/day (Q2) | 5,571 | −0.04 [−0.12, 0.04] |
| Men <2.34 drinks/day (Q3) | 5,708 | −0.06 [−0.14, 0.02] |
| Waist Circumference | 40,517 | β (95% CI) |
| Women ≤0.10 drinks/day (Q1) | 5,009 | Ref [0] |
| Women <0.56 drinks/day (Q2) | 4,841 | −0.86 [−1.22, −0.5] |
| Women <1.15 drinks/day (Q3) | 5,994 | −0.9 [−1.25, −0.56] |
| Men ≤0.52 drinks/day (Q1) | 4,712 | Ref [0] |
| Men <1.28 drinks/day (Q2) | 5,571 | −0.28 [−0.61, 0.04] |
| Men <2.34 drinks/day (Q3) | 5,708 | −0.23 [−0.56, 0.1] |
NOTES: Only groups or comparisons that met inclusion criteria are reported here. Slightly higher moderate categories are included here for completeness. BMI = body mass index; CI = confidence interval; N = number; Q1 = quartile 1; Q2 = quartile 2; Q3 = quartile 3.
a Moderate consumption: women ≤1 drink/day, men ≤2 drinks/day.
SOURCES: Adapted from Tables F-7 and F-9 in Appendix F, AND, 2024; Inan-Eroglu et al., 2022. Committee adjusted AND’s quartiles.
and 3 also had lower odds of overweight and obesity compared to women in quartile 1. In conclusion, women who had alcohol consumption at the upper end of moderate alcohol consumption had smaller gains in measures of adiposity (WC, WHR, BMI, and BF%) and had lower odds of having overweight and obesity as compared to those in quartile 1, but no differences were observed for men.
Sayon-Orea et al. (2011b) (low risk of bias) examined associations between alcohol consumption and type of alcoholic beverage and yearly weight gain and risk of overweight/obesity in a Mediterranean cohort. The authors followed 9,318 healthy adults for 6.1 years as part of a prospective cohort study and collected data on dietary intake and alcohol consumption via self-reported food frequency questionnaire and self-reported weight at baseline and every 2 years during follow-up. Alcohol consumption was classified as drinks per week for men and women (0, <1, 1–<2, 2–<7, or ≥7 drinks/week) all for moderate alcohol consumption for both women
TABLE 4-6 Odds of Overweight and Obesity by Moderate Alcohol Consumption Quantity in Men and Women Enrolled in the UK Biobank Studya
| Study and Drinking Quantity Category | N | Reported Data |
|---|---|---|
| Overweight (BMI ≥25) | 40,517 | OR (95% CI) |
| Women ≤0.10 drinks/day (Q1) | 5,009 | Ref [1.00] |
| Women <0.56 drinks/day (Q2) | 4,841 | 0.73 [0.61, 0.87] |
| Women <1.15 drinks/day (Q3) | 5,994 | 0.69 [0.58, 0.81] |
| Men ≤0.52 drinks/day (Q1) | 4,712 | Ref [1.00] |
| Men <1.28 drinks/day (Q2) | 5,571 | 1.03 [0.84, 1.26] |
| Men <2.34 drinks/day (Q3) | 5,708 | 0.97 [0.79, 1.20] |
| Obesity (BMI ≥30) | 40,517 | OR (95% CI) |
| Women ≤0.10 drinks/day (Q1) | 5,009 | Ref [1.00] |
| Women <0.56 drinks/day (Q2) | 4,841 | 0.65 [0.53, 0.79] |
| Women <1.15 drinks/day (Q3) | 5,994 | 0.57 [0.47, 0.69] |
| Men ≤0.52 drinks/day (Q1) | 4,712 | Ref [1.00] |
| Men <1.28 drinks/day (Q2) | 5,571 | 0.86 [0.70, 1.06] |
| Men <2.34 drinks/day (Q3) | 5,708 | 0.89 [0.72, 1.09] |
NOTES: Only groups or comparisons that met inclusion criteria are reported here. Slightly higher moderate categories are included here for completeness. BMI = body mass index; CI = confidence interval; N = number; OR = odds ratio; Q1 = quartile 1; Q2 = quartile 2; Q3 = quartile 3.
a Moderate consumption: women ≤1 drink/day, men ≤2 drinks/day.
SOURCE: Inan-Eroglu et al., 2022.
and men. Comparisons to the reference group (0 drinks/week) were not considered since the study authors confirmed never and former drinkers were included in this group. All associations were adjusted for sex, baseline BMI, smoking, and other covariates.
In adjusted analyses, there was no apparent difference in weight change (Table 4-7) or risk of overweight/obesity (Table 4-8) between alcohol consumption groups within moderate consumption. Similarly, no differences were noted for weight change or risk of overweight/obesity by type of alcoholic beverage (red wine, other wines, or beer/spirits). In conclusion, change in absolute weight and risk of overweight/obesity were similar among moderate alcohol consumers including by type of alcoholic beverage consumed.
Seki et al. (2021) (moderate risk of bias) conducted a retrospective cohort study using the Japanese Ministry of Health, Labor, and Welfare large-scale health check-up (HC) database. The study included 123,182 adults receiving an HC at least once between 2008 and 2012 and a
TABLE 4-7 Changes in Weight by Moderate Alcohol Consumption Category in Men and Women Enrolled in the SUN Cohort Studya
| Drinking Quantity Category | N | Reported Data β (95% CI) |
|---|---|---|
| <0.14 drinks/day | 1,520 | −2 [−67, +63] |
| 0.14–0.29 drinks/day | 1,689 | +10 [−54, +74] |
| 0.29–1 drinks/day | 2,778 | −8 [−67, +63] |
NOTES: Only groups or comparisons that met inclusion criteria are reported here. CI = confidence interval; N = number; SUN = Seguimiento Universidad de Navarra.
a Moderate consumption: women ≤1 drink/day, men ≤2 drinks/day.
SOURCE: Sayon-Orea et al., 2011b.
follow-up HC after 5 years. BMI and WC were measured during HCs, and obesity at the fifth-year HC was defined as a BMI ≥25 kg/m2 in accordance with Japan Society for the Study of Obesity recommendations. WC was used to define abdominal obesity. Alcohol consumption was measured via self-reported questionnaire and categorized by the amount of alcohol consumed in grams on drinking days (<20 grams, 20–40 grams, 40–60 grams, >60 grams); categories were the same for males and females. When converted to drinks per day, even the lowest category of alcohol consumption (<20 grams/day or the equivalent of <1.4 drinks/day) exceeded the Dietary Guidelines for Americans (DGA) recommendation for women. Therefore, since data were not stratified by sex, study results are not relevant to this report for risk of overweight/obesity since comparisons among moderate drinkers are not presented.
Thomson et al. (2012) (low risk of bias) analyzed data from 15,920 women in the Women’s Health Initiative (WHI) to estimate associations between baseline alcohol intake and weight change and incident overweight or obesity in postmenopausal women over seven years. Height and weight were measured using standardized procedures at WHI clinics
| Drinking Quantity Category | N | Reported Data (HR and 95% CI) |
|---|---|---|
| <0.14 drinks/day | 6,206 | 1.01 [0.81, 1.26] |
| 0.14–0.29 drinks/day | 6,716 | 1.04 [0.84, 1.29] |
| 0.29–1 drinks/day | 9,794 | 1.05 [0.86, 1.27] |
NOTES: Only groups or comparisons that met inclusion criteria are reported. CI = confidence interval; HR = hazard ratio; N = number; SUN = Seguimiento Universidad de Navarra.
SOURCE: Sayon-Orea et al., 2011b.
at baseline and weight was measured annually. Alcohol consumption was assessed via semi-quantitative food frequency questionnaire at baseline and categorized into quintiles (drinks/day): Q1 = 0–<0.014, Q2 = 0.014–0.13, Q3 = 0.13–0.46, Q4 = 0.46–0.97, and Q5 = 0.97–14.07 (converted from grams/day to drinks/day using 14 grams/drink). Q1 did not clearly exclude former drinkers (i.e., risk of abstainer bias), so comparisons among Q2, Q3, and Q4 are informative for the present report.
Across all alcohol consumption quintiles, there was an inverse dose–response weight change over 7 years, with higher intake quintiles being associated with less weight gain (Q2 7-year weight change: 1.3 kg, Q3: 0.9 kg, Q4: 0.6 kg, as estimated from Figure 1 in the Thomson et al., 2012 publication). No quantitative results were reported, but the linear trend across categories was significant within each year (p < 0.001). Adjusted hazard ratios were estimated for incident overweight or obesity for women categorized as normal weight at baseline for total alcohol consumption quintiles (Table 4-9) and for beer, wine, and liquor. Shown in Table 4-9, women in quintiles 2, 3, and 4 had similar reductions in risk of overweight and obesity. Results of total alcohol intake across quintiles were largely similar when stratified by age (50–59 years versus 60+ years) and restricted to never smokers. In conclusion, weight gain and risk of overweight and obesity did not appear to differ among postmenopausal women at different levels of moderate alcohol consumption.
TABLE 4-9 Hazard Ratios and 95% Confidence Intervals for Incident Overweight and Obesity by Moderate Alcohol Consumption Quantity in Women Enrolled in the Women’s Health Initiative Studya
| Drinking Quantity Category | N | Reported Data |
|---|---|---|
| Incident Overweight (BMI ≥25) | 13,822 | HR (95% CI) |
| 0.01–0.13 drinks/day (Q2) | 2,297 | 0.94 [0.86, 1.02] |
| 0.13–0.46 drinks/day (Q3) | 2,285 | 0.88 [0.81, 0.96] |
| 0.46–0.97 drinks/day (Q4) | 2,287 | 0.81 [0.74, 0.90] |
| Incident Obesity (BMI ≥30) | 13,822 | HR (95% CI) |
| 0.01–0.13 drinks/day (Q2) | 2,297 | 0.74 [0.49, 1.12] |
| 0.13–0.46 drinks/day (Q3) | 2,285 | 0.54 [0.34, 0.84] |
| 0.46–0.97 drinks/day (Q4) | 2,287 | 0.38 [0.22, 0.64] |
NOTES: Only groups or comparisons that met inclusion criteria are reported here. BMI = body mass index; CI = confidence interval; HR = hazard ratio; N = number; Q2 = quartile 2; Q3 = quartile 3; Q4 = quartile 4.
a Moderate consumption: women ≤1 drink/day.
SOURCE: Thomson et al., 2012.
Wang et al. (2010) (moderate risk of bias) conducted a prospective cohort study using data from the Women’s Health Study. The analysis included 19,220 U.S. women ≥39 years of age with a BMI indicating normal weight (BMI 18.5–<25 kg/m2) at baseline. Alcohol consumption was assessed via self-reported questionnaire at baseline and total alcohol intake was categorized as 0 grams/day, >0–<5 grams/day, 5–<15 grams/day, 15–<30 grams/day, and ≥30 grams/day. The committee focused on the following alcohol consumption categories that reflect moderate drinking according to the DGA for women: >0–<5 grams/day (>0–<0.36 drinks/day) and 5–<15 grams/day (0.36–1.1 drinks/day). Height and weight were self-reported at baseline and over 12.9 years of follow-up and used to calculate BMI to determine incidence of overweight and obesity.
Weight increased in the full sample but increased slightly less at each follow-up point in women who consumed 0.36–1.1 drinks/day compared to women who consumed >0–<0.36 drinks/day, though statistical significance was not reported. Shown in Table 4-10, women who consumed 0.36–<1.1 drinks/day had slightly lower risk of overweight/obesity (BMI ≥25) and lower risk of obesity (BMI ≥30) than women who consumed >0–<0.36 drinks/day. In conclusion, moderate drinking toward the upper versus the lower end of moderate consumption may be associated with less weight gain over time and lower risk of obesity in middle to older-aged women.
The committee reviewed seven cohort studies published between January 2010 and February 2024 in this systematic review with narrative
TABLE 4-10 Relative Risks and 95% Confidence Intervals for Incident Overweight/Obesity and Obesity by Moderate Alcohol Consumption Quantity in Middle-aged and Older Womena
| Study and Drinking Quantity Category | N | Reported Data |
|---|---|---|
| Overweight or obesity (BMI ≥25) | 19,220 | RR (95% CI) |
| >0–<0.36 drinks/day | 6,312 | 0.96 [0.91, 1.01] |
| 0.36–<1.1 drinks/day | 3,865 | 0.86 [0.80, 0.92] |
| Obesity (BMI ≥30) | 19,220 | RR (95% CI) |
| >0–<0.36 drinks/day | 6,312 | 0.75 [0.63, 0.89] |
| 0.36–<1.1 drinks/day | 3,865 | 0.43 [0.34, 0.56] |
NOTES: Only groups or comparisons that met inclusion criteria are reported here. Slightly higher moderate categories are included here for completeness. BMI = body mass index; CI = confidence interval; N = number; RR = relative risk.
a Moderate consumption: women ≤1 drink/day.
SOURCE: Wang et al., 2010.
synthesis. Data from six of these studies were included to develop the following findings and conclusions.
Findings
Finding 4-1: Abstainer bias was evident in all seven eligible studies published between 2010 and 2024; therefore, for weight-related outcomes (weight, BMI, risk of overweight/obesity, waist circumference) comparisons between those who consumed moderate alcohol and those who never consumed alcohol could not be made.
Finding 4-2: On the basis of three eligible studies, there was insufficient evidence to evaluate associations between the amount of moderate alcohol consumption and changes in body weight among men. Among women, the evidence was inconsistent. There were concerns related to sparse evidence, risk of bias (mainly due to confounding), and imprecision in the studies.
Finding 4-3: On the basis of two eligible studies, higher versus lower amounts of moderate alcohol consumption among men were associated with similar changes in BMI. Among women, the evidence was inconsistent. There were concerns related to risk of bias, mainly due to confounding, and imprecision in the studies.
Finding 4-4: On the basis of four eligible studies, higher versus lower amounts of moderate alcohol consumption among men were associated with similar risks of overweight and/or obesity. Among women, the evidence was inconsistent. There were concerns related to risk of bias, mainly due to confounding, and imprecision in the studies.
Finding 4-5: On the basis of three eligible studies, the evidence for changes in waist circumference comparing higher versus lower amounts of moderate alcohol consumption was inconsistent for women and for men. There were concerns related to sparse evidence and risk of bias, mainly due to confounding.
Conclusions
Conclusion 4-1: The committee determined that there was insufficient evidence to draw a conclusion regarding the association between weight-related outcomes and moderate alcohol consumption compared with never consuming alcohol.
Conclusion 4-2: The committee determined that there was insufficient evidence to draw a conclusion regarding the association between amounts of moderate alcohol consumption and changes in weight.
Conclusion 4-3: The committee concludes that higher versus lower amounts of moderate alcohol consumption among men were associated with similar changes in BMI (low certainty). Among women the evidence was inconsistent regarding changes in BMI.
Conclusion 4-4: The committee concludes that among men who moderately consume alcohol, higher versus lower amounts of moderate alcohol consumption were associated with similar risks of overweight and/or obesity (low certainty). Among women the evidence was inconsistent regarding changes in overweight and/or obesity.
Conclusion 4-5: The committee determined that there was insufficient evidence to draw a conclusion regarding an association between amounts of moderate alcohol consumption and changes in waist circumference.
In summary, this systematic review with narrative synthesis of studies published between January 2010 and February 2024 suggests there is insufficient evidence to draw strong conclusions on associations between moderate alcohol consumption for men and women and weight-related outcomes. Research gaps are fully described in Chapter 9.
Summary of Evidence Relative to Past DGA Guidance
Based on the results of the de novo SR, of studies published from 2010 to 2024, the committee concludes there was insufficient evidence to evaluate the main question of moderate alcohol consumption compared to never consuming alcohol, thus no comparison to prior versions of the DGA is possible for this question. In comparisons of lower versus higher consumption within moderate alcohol consumers the committee found little to no association of alcohol consumption with body habitus outcomes with an evidence grade of very low certainty as summarized in Conclusions 4-3, 4-4, and 4-5. This finding was consistent with the 2010 DGAC report that states that moderate alcohol consumption is not associated with weight gain. The 2015 and the 2020 DGAC reports did not evaluate the associations of moderate alcohol consumption compared to other levels of consumption in relation to weight-related outcomes.
REFERENCES
AND (Academy of Nutrition and Dietetics). 2024. Alcohol Consumption and Weight: Systematic Review. Appendix F available at https://nap.nationalacademies.org/catalog/28582 (accessed January 30, 2025).
Androutsos, O., K. Gerasimidis, A. Karanikolou, J. J. Reilly, and C. A. Edwards. 2015. Impact of eating and drinking on body composition measurements by bioelectrical impedance. Journal of Human Nutrition and Dietetics 28(2):165–171.
Bajaj, S. S., A. Zhong, A. L. Zhang, and F. C. Stanford. 2024. Body mass index thresholds for Asians: A race correction in need of correction? Annals of Internal Medicine 177(8):1127–1129.
Banack, H. R., S. N. Smith, and L. M. Bodnar. 2024. Application of a web-based tool for quantitative bias analysis: The example of misclassification due to self-reported body mass index. Epidemiology 35(3):359–367.
Barbour, L. A., T. L. Hernandez, R. M. Reynolds, M. S. Reece, C. Chartier-Logan, M. K. Anderson, T. Kelly, J. E. Friedman, and R. E. Van Pelt. 2016. Striking differences in estimates of infant adiposity by new and old dxa software, peapod and skin-folds at 2 weeks and 1 year of life. Pediatric Obesity 11(4):264–271.
Barson, J. R., and S. F. Leibowitz. 2016. Hypothalamic neuropeptide signaling in alcohol addiction. Progress in Neuro-Psychopharmacology & Biological Psychiatry 65:321–329.
Borgeson, E., S. Tavajoh, S. Lange, and N. Jessen. 2024. The challenges of assessing adiposity in a clinical setting. Nature Reviews Endocrinology.
Butler, J. L., P. Gordon-Larsen, L. M. Steffen, J. M. Shikany, D. R. Jacobs, Jr., B. M. Popkin, and J. M. Poti. 2023. Associations of 5-year changes in alcoholic beverage intake with 5-year changes in waist circumference and BMI in the Coronary Artery Risk Development In Young Adults (CARDIA) study. PLoS One 18(3):e0281722.
Butts, M., V. L. Sundaram, U. Murughiyan, A. Borthakur, and S. Singh. 2023. The influence of alcohol consumption on intestinal nutrient absorption: A comprehensive review. Nutrients 15(7).
Caton, S. J., L. Bate, and M. M. Hetherington. 2007. Acute effects of an alcoholic drink on food intake: Aperitif versus co-ingestion. Physiology & Behavior 90(2–3):368–375.
CDC (U.S. Centers for Disease Control and Prevention). 2012. Calories consumed from alcoholic beverages by U.S. adults, 2007–2010. https://www.cdc.gov/nchs/products/databriefs/db110.htm#:~:text=Men%20consume%20more%20calories%20from%20alcoholic%20beverages%20than%20women%3B%20on,fewer%20calories%20from%20alcoholic%20beverages (accessed 09/24/2024).
CDC. 2024. Adult BMI categories. https://www.cdc.gov/bmi/adult-calculator/bmi-categories.html (accessed July 24, 2024).
Choi, S., K. Kim, J. K. Lee, J. Y. Choi, A. Shin, S. K. Park, D. Kang, and S. M. Park. 2019. Association between change in alcohol consumption and metabolic syndrome: Analysis from the health examinees study. Diabetes & Metabolism Journal 43(5):615–626.
Cigolini, M., G. Targher, I. A. Bergamo Andreis, M. Tonoli, F. Filippi, M. Muggeo, and G. De Sandre. 1996. Moderate alcohol consumption and its relation to visceral fat and plasma androgens in healthy women. International Journal of Obesity and Related Metabolic Disorders 20(3):206–212.
Conte, C., K. D. Hall, and S. Klein. 2024. Is weight loss-induced muscle mass loss clinically relevant? JAMA 332(1):9–10.
Council on Science and Public Health. 2024. Support for evidence-based use of BMI as a measure in medicine H-440.797. In CSAPH Reports. 03, A-24.
Cuevas, A. G., and W. C. Willett. 2024. Weighing in on the body mass index: Addressing criticisms and embracing purpose. Annals of Internal Medicine 177(8):1125–1126.
Dettoni, R., C. Bahamondes, C. Yevenes, C. Cespedes, and J. Espinosa. 2023. The effect of obesity on chronic diseases in USA: A flexible copula approach. Science Reports 13(1):1831.
Dhurandhar, N. V., D. Schoeller, A. W. Brown, S. B. Heymsfield, D. Thomas, T. I. Sorensen, J. R. Speakman, M. Jeansonne, D. B. Allison, and G. Energy Balance Measurement Working. 2015. Energy balance measurement: When something is not better than nothing. International Journal of Obesity (Lond) 39(7):1109–1113.
Eiler, W. J., II, M. Dzemidzic, K. R. Case, C. M. Soeurt, C. L. Armstrong, R. D. Mattes, S. J. O’Connor, J. Harezlak, A. J. Acton, R. V. Considine, and D. A. Kareken. 2015. The aperitif effect: Alcohol’s effects on the brain’s response to food aromas in women. Obesity (Silver Spring) 23(7):1386–1393.
Ferdouse, A., and R. D. Clugston. 2022. Pathogenesis of alcohol-associated fatty liver: Lessons from transgenic mice. Frontiers in Physiology 13:940974.
Fields, D. A., M. I. Goran, and M. A. McCrory. 2002. Body-composition assessment via air-displacement plethysmography in adults and children: A review. American Journal of Clinical Nutrition 75(3):453–467.
Flegal, K. M., B. I. Graubard, D. F. Williamson, and M. H. Gail. 2018. Excess deaths associated with underweight, overweight, and obesity: An evaluation of potential bias. Vital Health Statistics 3(42):1–21.
Flegal, K. M., B. I. Graubard, and J. P. A. Ioannidis. 2021. Evaluation of a suggested novel method to adjust BMI calculated from self-reported weight and height for measurement error. Obesity (Silver Spring) 29(10):1700–1707.
Frankenfield, D. C., W. A. Rowe, R. N. Cooney, J. S. Smith, and D. Becker. 2001. Limits of body mass index to detect obesity and predict body composition. Nutrition 17(1): 26–30.
Fryar, C. D., M. D. Carroll, Q. Gu, J. Afful, and C. L. Ogden. 2021. Anthropometric reference data for children and adults: United states, 2015-2018. Vital & Health Statistics 3(36): 1–44.
Gonzalez-Reimers, E., F. Santolaria-Fernandez, M. C. Martin-Gonzalez, C. M. Fernandez-Rodriguez, and G. Quintero-Platt. 2014. Alcoholism: A systemic proinflammatory condition. World Journal of Gastroenterology 20(40):14660–14671.
Gunzerath, L., V. Faden, S. Zakhari, and K. Warren. 2004. National institute on alcohol abuse and alcoholism report on moderate drinking. Alcoholism, Clinical and Experimental Research, 28(6):829–847.
GWU (George Washington University). n.d. Consensus statement on obesity as a disease. https://stop.publichealth.gwu.edu/obesity-statement (accessed July 18, 2024).
Holt, P. R., O. Altayar, and D. H. Alpers. 2023. Height with age affects body mass index (BMI) assessment of chronic disease risk. Nutrients 15(21).
Inan-Eroglu, E., B. H. Huang, M. Hamer, A. Britton, and E. Stamatakis. 2022. Alcohol consumption and adiposity: A longitudinal analysis of 45,399 UK Biobank participants International Journal of Environmental Research and Public Health 19(19).
Jaeschke, L., A. Steinbrecher, and T. Pischon. 2015. Measurement of waist and hip circumference with a body surface scanner: Feasibility, validity, reliability, and correlations with markers of the metabolic syndrome. PLoS One 10(3):e0119430.
Janssen, I., P. T. Katzmarzyk, and R. Ross. 2002. Body mass index, waist circumference, and health risk: Evidence in support of current National Institutes of Health guidelines. Archives of Internal Medicine 162(18):2074–2079.
Kelly, T. L., K. E. Wilson, and S. B. Heymsfield. 2009. Dual energy x-ray absorptiometry body composition reference values from nhanes. PLoS One 4(9):e7038.
Keramat, S. A., K. Alam, R. H. Rana, R. Chowdhury, F. Farjana, R. Hashmi, J. Gow, and S. J. H. Biddle. 2021. Obesity and the risk of developing chronic diseases in middle-aged and older adults: Findings from an Australian longitudinal population survey, 2009–2017. PLoS One 16(11):e0260158.
Lieber, C. S. 2003. Relationships between nutrition, alcohol use, and liver disease. Alcohol Research & Health 27(3):220–231.
Lu, Y., and J. George. 2024. Interaction between fatty acid oxidation and ethanol metabolism in liver. American Journal of Physiology. Gastrointestinal and Liver Physiology 326(5):G483–G494.
Nevill, A. M., M. J. Duncan, and T. Myers. 2022. BMI is dead; Long live waist-circumference indices: But which index should we choose to predict cardio-metabolic risk? Nutrition, Metabolism, and Cardiovascular Diseases32(7):1642–1650.
Pi-Sunyer, X. 2009. The medical risks of obesity. Postgraduate Medicine 121(6):21–33.
Ritchie, J. D., C. K. Miller, and H. Smiciklas-Wright. 2005. Tanita foot-to-foot bioelectrical impedance analysis system validated in older adults. Journal of the American Dietetic Association 105(10):1617–1619.
Ross, R., I. J. Neeland, S. Yamashita, I. Shai, J. Seidell, P. Magni, R. D. Santos, B. Arsenault, A. Cuevas, F. B. Hu, B. A. Griffin, A. Zambon, P. Barter, J. C. Fruchart, R. H. Eckel, Y. Matsuzawa, and J. P. Despres. 2020. Waist circumference as a vital sign in clinical practice: A consensus statement from the IAS and ICCR working group on visceral obesity. Nature Reviews Endocrinology 16(3):177–189.
Sayon-Orea, C., M. A. Martínez-González, and M. Bes-Rastrollo. 2011a. Alcohol consumption and body weight: A systematic review. Nutrition Reviews 69(8):419–431.
Sayon-Orea, C., M. Bes-Rastrollo, J. M. Nunez-Cordoba, F. J. Basterra-Gortari, J. J. Beunza, and M. A. Martínez-González. 2011b. Type of alcoholic beverage and incidence of overweight/obesity in a mediterranean cohort: The SUN project. Nutrition 27(7–8): 802–808.
Seki, T., M. Takeuchi, and K. Kawakami. 2021. Eating and drinking habits and its association with obesity in Japanese healthy adults: Retrospective longitudinal big data analysis using a health check-up database. British Journal of Nutrition 126(10):1585–1591.
Stanford, F. C., M. Lee, and C. Hur. 2019. Race, ethnicity, sex, and obesity: Is it time to personalize the scale? Mayo Clinic Proceedings 94(2):362–363.
Suter, P. M. 2005. Is alcohol consumption a risk factor for weight gain and obesity? Critical Reviews in Clinical Laboratory Sciences 42(3):197–227.
Suter, P. M., Y. Schutz, and E. Jequier. 1992. The effect of ethanol on fat storage in healthy subjects. New England Journal of Medicine 326(15):983–987.
Suter, P. M., E. Hasler, and W. Vetter. 1997. Effects of alcohol on energy metabolism and body weight regulation: Is alcohol a risk factor for obesity? Nutrition Reviews 55(5):157–171.
Sweatt, K., W. T. Garvey, and C. Martins. 2024. Strengths and limitations of BMI in the diagnosis of obesity: What is the path forward? Current Obesity Reports 13(3):584–595.
Tatsumi, Y., A. Morimoto, K. Asayama, N. Sonoda, N. Miyamatsu, Y. Ohno, Y. Miyamoto, S. Izawa, and T. Ohkubo. 2018. Association between alcohol consumption and incidence of impaired insulin secretion and insulin resistance in Japanese: The Saku study. Diabetes Research and Clinical Practice 135:11–17.
Thomson, C. A., B. C. Wertheim, M. Hingle, L. Wang, M. L. Neuhouser, Z. Gong, L. Garcia, M. L. Stefanick, and J. E. Manson. 2012. Alcohol consumption and body weight change in postmenopausal women: Results from the women’s health initiative. International Journal of Obesity (Lond) 36(9):1158–1164.
Traversy, G., and J. P. Chaput. 2015. Alcohol consumption and obesity: An update. Current Obesity Reports 4(1):122–130.
Wang, Z. M., R. N. Pierson, Jr., and S. B. Heymsfield. 1992. The five-level model: A new approach to organizing body-composition research. American Journal of Clinical Nutrition 56(1):19–28.
Wang, L., I. M. Lee, J. E. Manson, J. E. Buring, and H. D. Sesso. 2010. Alcohol consumption, weight gain, and risk of becoming overweight in middle-aged and older women. Archives of Internal Medicine 170(5):453–461.
Westerterp-Plantenga, M. S., and C. R. Verwegen. 1999. The appetizing effect of an aperitif in overweight and normal-weight humans. American Journal of Clinical Nutrition 69(2):205–212.
WHO (World Health Organization). 2004. Appropriate body-mass index for Asian populations and its implications for policy and intervention strategies. The Lancet 363(9403): 157–163.
WHO Expert Consultation. 2008. Waist circumference and waist–hip ratio: Report of a WHO expert consultation. Geneva.
Wu, H., and C. M. Ballantyne. 2020. Metabolic inflammation and insulin resistance in obesity. Circulation Research 126(11):1549–1564.
Xiao, J., S. A. Purcell, C. M. Prado, and M. C. Gonzalez. 2018. Fat mass to fat-free mass ratio reference values from nhanes III using bioelectrical impedance analysis. Clinical Nutrition 37(6 Pt A):2284–2287.
Zuo, X., X. Li, K. Tang, R. Zhao, M. Wu, Y. Wang, and T. Li. 2023. Sarcopenia and cardiovascular diseases: A systematic review and meta-analysis. Journal Cachexia, Sarcopenia and Muscle 14(3):1183–1198.
This page intentionally left blank.


