Risk Management at State DOTs: Building Momentum and Sustaining the Practice (2025)
Chapter: Appendix A: Practitioner Survey Summary
Overview and Survey Purpose
The objective of this research is to develop content on how to implement and sustain the use of risk management at state departments of transportation (DOTs). The findings of the overall research will include information on value proposition, organizational change, promotion, and mindset and culture, among others needed to implement and sustain risk management. This research is intended to assist transportation agencies in building and maintaining program-level risk management as a core pillar within their agencies. To assist with this research, a brief risk management practitioner survey was developed and conducted to better understand how risk management is currently being implemented and sustained within a range of organizations, including transportation and similar public sector organizations.
The survey was developed and tested by the research team to take approximately 10 to 12 minutes to complete and was conducted through the Google Forms online survey platform between September 6–27, 2022. The survey consisted of approximately 30 multiple-choice or short-response questions. Survey participants were informed that responses would be aggregated to provide a baseline understanding of practices implemented to assist in building momentum and sustaining risk management practices within organizations or agencies with a focus on organizational traits and change management strategies needed to overcome barriers to implementing and sustaining formal risk management. Survey participants were selected from a variety of city, state, and MPOs, utility companies, international agencies, academia, and consultants. In addition, the team requested surveys from members of various AASHTO and TRB committees.
Survey findings supported Task 3, a targeted literature review and gap assessment, and Task 4, an industry roundtable of the project. The identified gap areas that agencies called out in their responses to the survey questions were pursued in the targeted literature review in Task 3 by seeking information and approaches used from within the transportation industry and sister industries, such as water/wastewater or energy sectors, to close these gaps. The survey respondents also served as a potential source of participants for the industry roundtable conducted in Task 4. In addition, the research team held a listening session during the AASHTO Committee on Performance-Based Management (CPBM) conference in December 2022 and hosted a 3-hour, interactive online workshop in February 2023.
Survey Participants
Invitations to participate in the brief risk management practitioner survey were distributed to a broad range of risk management professionals through individual email invitations. This distribution list included a variety of public and private sector risk practitioners, TRB and AASHTO committee chairs, and key risk management staff within DOTs to identify potential participants. The invitation included information about the project, the purpose of the survey, and a link to participate in the survey.
To track the type of practitioners taking the survey, participants were asked to provide the name of their employer and their role within that entity. The survey was embedded within the invitation to expedite completion of the survey. Invitations were sent to 288 individuals, and the research team received 44 completed surveys, which is approximately a 15% response rate. A response greater than 10% indicates a good response (Graglia 2023). It is also likely the number of individuals who received the survey is more than the initial email, as some of the recipients of the email (e.g., committee chairs) forwarded the email to others and were encouraged to do so. Of the 44 respondents, a majority (33) noted they are employees of a public transportation agency, with the remaining 11 noting they do not work for a public agency. The primary positions held
by the respondents include Asset Manager (10), Performance Manager (7), and Enterprise Risk Manager (4). Other positions held by the survey participants included the following:
- Director of Risk
- Risk and Compliance
- Consultant
- Champion
- Administrator
- Safety/Risk Management/Emergency Management
- DOT Executive Leader over Enterprise Risk, Assets, and Performance
- Deputy Director Right-of-Way
- Director of Risk
- Assistant Commissioner
- Program Manager
- Division Management
- Recent Retiree - ADOT Risk Management, contracted support to risk management
- Branch Manager - Lead Asset, Performance, and Risk and Resilience Management
- Manager of a team that provides Asset Manager (AM), Project Manager (PM), Design Manager (DM), and Risk Manager (RM) functions
- Director of Transportation Safety and System Analysis
- Transportation Planner
- Senior Project Manager
- Resilience Planning
Survey Content and Logistics
The content of the survey included a brief explanation of NCHRP Project 08-151 objectives and a handful of questions specific to the practitioner’s agency or company, or the company or agency they commonly work for. The survey focused on their response to risk management policies and processes as well as questions about their experience in building and sustaining risk management within their agency/company. The survey aimed to highlight critical success factors and challenges for building and sustaining risk management within an agency or company.
In addition, survey participants were asked about the greatest challenges and biggest gaps to risk management implementation, tools that have helped sustain the momentum, various benefits to transportation agencies in implementing risk management, and how agency structure and processes help to build and sustain risk management.
The research team members produced and reviewed the survey questions, tabulated results once all practitioners’ responses were recorded, and summarized the survey key findings as follows.
“At-a-Glance” Findings from the Completed Surveys
The 12 questions (and subparts) in the brief risk management practitioner survey concerned these four main themes: (1) building and sustaining risk management, (2) benefits of risk management, (3) organizational structure, and (4) business processes. The at-a-glance findings from the completed surveys can be summarized as follows:
Theme 1: Building and Sustaining Risk Management
- The top three needs identified for building and sustaining a risk management focus with an agency or company are related to processes, organizational culture, and leadership support.
- The top three challenges identified for both building and sustaining risk management practices are related to staffing, lack of understanding, and business processes that are unclear or siloed.
- The top two knowledge gaps an agency or company confronts for both building and sustaining risk management practices are processes and measurement quantification. The third-most-selected knowledge gap varied between the building and sustaining risk management practices question: building identified data/tools versus sustaining identified communication.
Theme 2: Benefits of Risk Management
- Identifying uncertainties, estimating consequences, estimating probable occurrences, and estimating system vulnerabilities were identified as the significant benefits of risk management to transportation agencies. These benefits help position the agency for future strategy implementation.
- Risk visualization tools and asset replacement costs were also beneficial but not as strong. Having these visualization tools and replacement costs helps the agency to “tell the story” and show the impacts of using risk management within the agency.
Theme 3: Organizational Structure
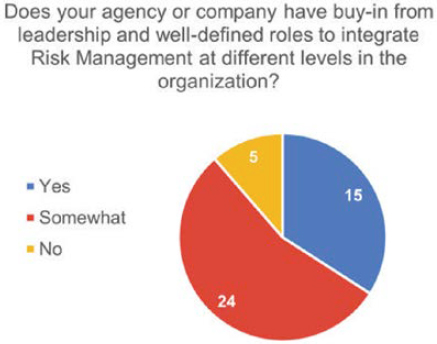
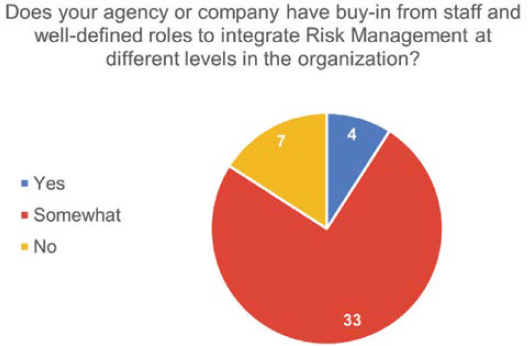
- Most respondents noted that having buy-in from leadership and staff, in addition to well-defined roles to integrate risk management at different levels in their organization, was instrumental in building and sustaining risk management.
- Those who indicated “yes” there is buy-in from both leadership and staff noted that leadership had a greater percentage of buy-in than staff (33 compared with 4 responses). This indicates that even though leadership is supportive of building and sustaining risk management within the agency/company, there is still work needed to enable staff to understand its value and embed it in their business processes.
Theme 4: Business Processes
- Internal communication and promotion of risk management, integrating risk within existing processes, and tool and data development were noted to have occurred at their agency within the past year by many survey participants. This is a positive step toward building and sustaining risk management within agencies.
- Most agencies have conducted scenario planning of relevant uncertainties for system infrastructure and operations. Scenario planning helps the agency to understand and consider uncertainty within their agency on multiple levels.
- Agencies vary in using formal risk management policies but typically find that even informal policies are still somewhat effective.
Overarching Findings from the Completed Surveys
The 12 questions (and subparts) in the survey concerned four main themes. Within each theme, there were interesting and overarching findings that informed and supported Task 3, a targeted literature review and gap assessment, and Task 4, an industry roundtable.
Most survey participants indicated they are an employee of a public transportation agency. Slightly more than half of the participants indicated they felt the highest level of comfort with
including risk management in their agency. What this reveals is that there is an opportunity and a need to bridge that gap so more practitioners can have the necessary tools and resources to build and sustain risk management within their agency.
Theme 1: Building and Sustaining Risk Management (Questions 2–4)
Question 2 focused on what is needed to build and sustain a risk management focus within an agency/company. Most respondents indicated that processes to integrate risk into applicable decision points, organizational change/culture of risk, and leadership support are the top three things that are needed to build and sustain a risk management focus with an agency/company. The detailed results are shown in the following graphic.
Question 2:

Question 3(a–c) asked about challenges, success factors, and knowledge gaps when building a risk management practice. The top three challenges confronted when building risk management practices were noted as a lack of staff resources, lack of understanding/competence in risk management, and unclear or siloed business processes. For Question 3c, the top three knowledge gaps an agency or company confronts in building risk management practices are processes, risk measurement/quantification, and data/tools.
Whereas Question 3 focused on building risk management, Question 4 focused on sustaining risk management. Question 4(a–d) asked about challenges, success factors, and knowledge gaps. Survey participants cited the same challenges for both building and sustaining risk management practices: the need for staff resources was identified by nearly half of the respondents, followed by the need for better understanding/competence in risk management, and unclear or siloed business processes.
Survey participants identified slightly different knowledge gaps an agency or company confronts for building compared with sustaining risk management practices. Respondents similarly identified processes and risk measurement/quantifications as key gaps, but instead of identifying
data/tools as the third-most-selected gap (as elevated within the building focus), communication was the third-most-selected gap for sustaining a risk management focus.
Question 4d asked if there were any tools they have used to sustain risk management. A variety of tools were identified, including performance measures, incorporation of risk into project selection through scoring, scenario risk assessment, and inclusion in transportation asset management plans.
Theme 2: Benefits of Risk Management (Question 5)
Question 5 contained six subparts that asked survey participants to what degree they agreed with statements about the benefits of conducting certain processes or incorporation of tools as it relates to building and sustaining risk management efforts in an agency. These are listed in order of the greatest percentage of respondents who agreed or strongly agreed to the statement that incorporating these concepts, tools, or processes would be beneficial to an agency trying to build or sustain risk management:
- Estimation of probability of occurrence of applicable risks (93.2%) (Question 5d).
- Estimation of system vulnerability that accounts for the condition of assets and proactive measures to withstand applicable risks (93.2%) (Question 5e).
- Identifying relevant uncertainties for agency assets and operations (90.9% strongly agree) (Question 5a).
- Estimation of expected consequences to assets and operations from applicable risks (90.9%) (Question 5b).
- Risk visualization tools (81.8%) (Question 5f).
- Asset replacement cost (70.5%) (Question 5c).
Identifying uncertainties, estimating consequences, estimating probable occurrences, and estimating system vulnerabilities were overwhelmingly identified as beneficial. Risk visualization tools and asset replacement costs were also beneficial but not as strong.
Theme 3: Organizational Structure (Question 6)
Most respondents noted having some amount of buy-in from leadership and staff, in addition to having well-defined roles to integrate risk management at different levels in their organization, was paramount in building and sustaining risk management. Those who indicated “yes” there is buy-in from both leadership and staff noted that leadership had a greater percentage of buy-in than staff [34.1% (15) compared with 9.1% (4)]. Noticeably, respondents indicated there is “somewhat” of a buy-in at a much greater level by staff than leadership [75% (33) compared to 54.5% (24)].
Question 6a:
Question 6b:
Theme 4: Business Processes (Question 7)
The top three processes that survey participants selected from a list as having occurred at their agency/company within the past year included: internal communication and promotion of risk management, integrating risk with existing processes, and data and tool development. More than half of the respondents selected these three processes. All other processes in the provided list had been incorporated by less than half of the respondents.
The top two risk management tools used included deterministic modeling of risk including spreadsheet and basic analysis tools (e.g., Microsoft Excel, Access) and geographic information systems (e.g., ArcGIS, QGIS, Tableau, Python); nearly two-thirds of all respondents selected these tools. All other listed tools are used by 39% or less of the respondents in many instances.
The top three risks that respondents selected that their agency quantifies included environmental and climate change impacts, natural hazards, and economic changes (refer to the following graphic).
Question 7c:

Other Interesting Overarching Findings (Questions 8–12)
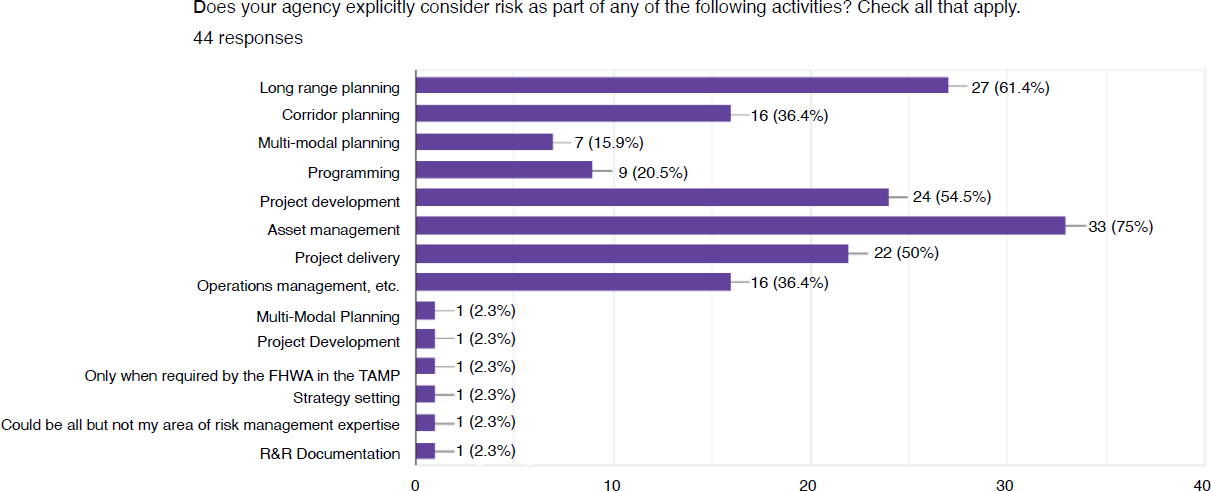
Two-thirds of the respondents indicated their agency has conducted scenario planning of relevant uncertainties for system infrastructure and operations. The top three activities where respondents indicated their agency explicitly considers risk included asset management (75%), long-range planning (61.4%), and project development (54%) (refer to the following graphic).
Question 9:
More than two-thirds of the respondents indicated their agency has either an informal risk management policy or no policy or process. One-quarter indicated there was a formal policy. While agencies vary in using formal risk management policies, most respondents indicated even informal policies are still somewhat effective.
Conclusion
The information gathered during the survey did help the research team better understand what needs to be developed and created to help transportation agencies build and sustain risk management within their organizations. The survey responses highlighted the current state and helped inform the research team on how risk management is currently being implemented and sustained within a range of organizations, including transportation and similar public sector organizations.
These survey results were used as a critical element within Task 3. The identified gap areas that agencies called out in their responses to the survey questions were intensely followed in the targeted literature review and were incorporated into the gap assessment. The survey responses were also verified during the listening session held at the AASHTO Committee on Performance-Based Management (CPBM) conference in December 2022. Once the survey responses were verified and the gap assessment was prepared, the survey responses were used to inform Task 4, an industry roundtable.


