Microtransit Solutions in Rural Communities: On-Demand Alternatives to Dial-a-Ride Services and Unproductive Coverage Routes (2025)
Chapter: 3 Survey Results
CHAPTER 3
Survey Results
Introduction
For purposes of the survey for this synthesis, the study team identified 27 agencies—18 U.S. agencies, two Canadian agencies, and seven agencies in the United Kingdom—that currently operate or previously operated on-demand microtransit service in rural areas. Nineteen agencies responded: 13 U.S. agencies, one Canadian agency, and five agencies in the United Kingdom (Figure 1).
The respondents represent local or regional transit agencies (53 percent), divisions of a municipality (21 percent), nonprofit organizations that provide transit (21 percent), and a Council of Governments (5 percent).
The survey included 52 questions about microtransit planning, service models, performance metrics, funding, marketing, and other topics related to providing rural microtransit service. Most questions were optional, and most of the multiple-choice questions enabled respondents to select multiple answers, so not all totals displayed in the following results add up to 19, or 100 percent.
Key Survey Takeaways
- Customer feedback was highly positive, almost universally. The customer service ratings shared by the agencies ranged from 4.5 to 4.94 on a 1–5 scale and 90–99 percent on a 100-percent scale. Two U.S. agencies mentioned they found the flexibility of the service highly positive, even “life-changing” for customers.
- All the U.S. respondents’ services are directly operated (i.e., do not use the turnkey model). A few agencies mentioned wanting to maintain adequate control over the service provision and quality as a motivation for this decision. The reason for the lack of fully contracted service providers in rural areas was unclear.
- Agencies had a variety of reasons for implementing microtransit. The most common reasons identified for implementing microtransit service was to increase connections to fixed-route service, including fixed-route service operated by the same agency, fixed-route service operated by other agencies, regional routes and rail, and intercity bus service. Five agencies implemented microtransit to replace flexible fixed-route or fixed-route service, and five agencies are using microtransit to provide service in a new area.
- About half the services are operated by unionized operators, and multiple agencies involved union members throughout the process of planning and implementing the microtransit service. Similar to fixed-route service, some are unionized and some are not. The introduction of microtransit has been known in some cases to create tension with other unionized operators; no responding agencies reported issues with implementing microtransit with union members.

- Satisfaction with the software used for dispatch, scheduling, and routing varied significantly. A few respondents commented on the importance of testing the software first to ensure that it would be able to deliver on all the capabilities promised by vendors during the procurement process.
- App-based booking is a feature not used by the majority of passengers in many cases; the average percentage of trips that are booked by app among responding U.S. agencies is 40 percent. The most common reported barrier to app-based booking is riders not being comfortable using a smartphone. Two agencies mentioned that the proportion of app-based booking is growing over time for them.
- Cash payment is still common. Six responding agencies, five of which are U.S. agencies, have half or more trips paid for by cash.
- The majority of vehicles used for microtransit service are wheelchair accessible. Only two U.S.-based agencies reported having vehicles in their fleets that are not wheelchair accessible.
- Responses varied in terms of whether on-demand microtransit had reduced or increased costs. Two agencies reported a higher overall service cost, two reported a lower total service cost, and one said total costs have remained stable.
- Most agencies underwent a visioning and/or goal-setting process before establishing an on-demand microtransit service. Common goals identified through these processes included expanding transit access, enhancing the customer experience, and improving service reliability and operating efficiency.
- About half of responding agencies said they established pre-defined performance metrics for their microtransit service. More than half reported that they have adjusted their service
- in response to performance. This has included adding additional terminals and hubs to reduce deadhead miles; hiring new drivers in some areas to maintain short wait times and high on-time performance; and adding vehicles to accommodate more riders and reduce the number of unbooked trips.
Survey Respondent Characteristics
Table 3 shows information for U.S.-based agencies provided by each agency about their organization and microtransit service. Table 4 shows the information for agencies outside the United States.
These tables highlight a few key findings:
- Among U.S. respondents, all the agencies that responded to the survey directly operate their microtransit service (i.e., the service is not operated through a turnkey contract with the technology provider).
- The agencies range widely in terms of ridership, with between 55 and 9,625 passenger trips per month. All but one of the agencies currently operating provide at least 500 passenger trips per month.
- Microtransit vehicle count was positively correlated with ridership, with fleet size for U.S. respondent agencies ranging from one to 72, with an average of 20.
- The zone populations ranged from just over 3,000 to over 360,000, with an overall positive correlation between zone size and population.
- The governance structure of the U.S. respondents varied, with some being divisions within a municipality, some being local or regional authorities or nonprofit organizations, and one being a consortium of agencies. Among the U.K.- and Canada-based agencies, all reported being a local or regional authority.
- All the survey respondent agencies still operating microtransit started their service after the onset of the COVID-19 pandemic in March 2020. In the United States, most started their service in 2022 or 2023.
- All the U.S. respondents reported that they operate another service in addition to microtransit.
- Adoption of the mobile app varied widely from between 5 percent and 80 percent among U.S. agencies. Among the four agencies in the U.K. that responded to the question about app usage, the average adoption rate of the app was 70 percent, with three of the four agencies having rates above 75 percent and one as high as 92 percent.
Planning and Service Design
Fifteen agencies (79 percent) started their microtransit service as a pilot project. Among U.S. respondents, 85 percent said their services started as a pilot. The most common reason identified for implementing microtransit service was to increase connections to fixed-route service, selected by nine agencies (Figure 2). While seven agencies operate fixed-route service, first-mile/last-mile connections in some cases include connections to fixed-route services operated by other agencies, regional routes and rail, and intercity bus service. Five agencies implemented microtransit to replace flexible fixed-route or fixed-route service, and five agencies are using microtransit to provide service in a new area. While three agencies implemented microtransit service to replace paratransit or dial-a-ride service, other agencies indicated that they encourage ADA riders to use microtransit even though they have maintained their other demand response service. Other reasons multiple agencies gave for implementing microtransit included trying out the technology, attracting new riders, and improving connectivity.
Table 3. Survey question responses by agency—U.S.-based agencies.
| Agency | Number of Zone(s) and Size(s) | Est. Zone pop. | Agency Type | Monthly Ridershipa | Service Start | Microtransit Fleet (% Wheelchair-Accessible Vehicles) | Total Fleet | Service Modelb | % of Trips Booked by App | Other Services Providedc |
|---|---|---|---|---|---|---|---|---|---|---|
| Baldwin Regional Area Transit System (AL)d | Countywide, 1,590 sq. mi. | 231,770 | A division of a single municipality | 8,465 | September 2020 | 46 (96%) | 46 | Directly operated | 48% |
|
| Battle Creek Transit (MI) | Countywide, 719 sq. mi. | 134,310 | A local or regional public transit agency or authority | 687 | March 2021 | 5 (100%) | 24 | Directly operated | 70% |
|
| Bay Area Transportation Authority (MI) | Countywide (two counties), 950 sq. mi. | 117,540 | A local or regional public transit agency or authority | 9,625 | July 2023 | 30 (100%) | 85 | Directly operated | 45% |
|
| Bay Transit (VA) | One zone, 17 sq. mi. | [not provided or available online] | A private, nonprofit organization | 1,490 | July 2021 | 3 (100%) | 48 | Directly operated | 50% |
|
| Hall Area Transit (GA) | Countywide, 361sq. mi. | 203,140 | A division of a single municipality | 7,340 | July 2022 | 31 (100%) | 33 | Directly operated | - |
|
| GoWake Access Transportation (NC) | One zone, 100 sq. mi. | 43,000 | A division of a single municipality | 55 | April 2022 | 4e | 72 | Directly operated | 50% |
|
| Heart of Iowa Regional Transit Agency (IA) | Countywide (seven counties), 4,177 sq. mi. | 365,100 | A local or regional public transit agency or authority | 6,604 | October 2022 | 72 (100%) | 72 | Directly operated | - |
|
| Agency | Number of Zone(s) and Size(s) | Est. Zone pop. | Agency Type | Monthly Ridershipa | Service Start | Microtransit Fleet (% Wheelchair-Accessible Vehicles) | Total Fleet | Service Modelb | % of Trips Booked by App | Other Services Providedc |
|---|---|---|---|---|---|---|---|---|---|---|
| Mountain Empire Older Citizens (VA) | One zone, 15 sq. mi. | [not provided or available online] | A private, nonprofit organization | 4,333 | June 2021 | 4 (100%) | 52 | Directly operated | 80% |
|
| North Central Regional Transit District (NM) | Three zones: 43 sq. mi.; 652 sq. mi.; 26 sq. mi. (within previous zone) | 2,050; 43,550; 3,240 (respectively) | A local or regional public transit agency or authority | 1,165 | December 2022 | 10 (100%) | 75 | Directly operated | 5% |
|
| PICK Transportation (OK) | 19 zones ranging from 15-45 sq. mi. | Ranges by zone from 3,800 to 40,000 | Consortium of agencies | 1,811 | August 2023 | 44 (100%) | 200f | Directly operated | 48% |
|
| Southeast Vermont Transit (VT) | One zone, 20 sq. mi. | 3,400 | A private, nonprofit organization | 558 | January 2023 | 1e | 62 | Directly operated | 5% |
|
| Town of Great Barrington (MA) | Three zones | [not provided or available online] | A division of a single municipality | 1,207 | May 2023 | 6 (50%) | 6 | Directly operated | 20% |
|
| YVEDDI Public Transportation (NC) | Two town-wide zones: 6.2 sq. mi.; 7.6 sq. mi. | 4,120; 5,900 | A private, nonprofit organization | 1,389 | July 2023 | 6 (100%) | 55 | Directly operated | 20% |
|
YVEDDI = Yadkin Valley Economic Development District, Inc.
a. The survey asked for the number of riders in the past year, or, for services operating less than one year, the number of riders since implementation.
b. Per definition in Chapter 1.
c. Bolded agencies are those selected as case examples and profiled in Chapter 4.
d. “Other demand response” refers to a traditional Dial-A-Ride service or paratransit service, if separate from microtransit service.
e. Percentage of vehicles that are wheelchair accessible not provided.
f. Across all the consortium members who operate during daytime hours.
Table 4. Survey question responses by agency – agencies outside the United States.
| Agency | Number of Zone(s) and Size(s) in Square Miles | Agency Type | Monthly Ridershipa | Service Start | Microtransit Fleet (% Wheelchair-Accessible Vehicles) | Total Fleet | Service Model | % of Trips Booked by App | Other Services Providedb |
|---|---|---|---|---|---|---|---|---|---|
| Cheshire West and Chester Council (UK) | One zone | A local or regional public transit agency or authority | 1,487 | July 2023 | 2 | 2c | Contracted service | 76% | - |
| Hertfordshire County Council (UK) | Two zones | A local or regional public transit agency or authority | 3,189 | September 2021 | 7 (100%) | 22 | Contracted service | 92% | - |
| Moray Council (UK) | Four operating areas with zone structures | A local or regional public transit agency or authority | 2,067 | May 2023 | 16 (80%) | 38 | Directly operated | 33% |
|
| North Lincolnshire Council (UK) | Countywide | A local or regional public transit agency or authority | 1,083 | September 2020 | 4 (100%) | 6 | Contracted service | 80% |
|
| TransLink (Canada) | One zone | A local or regional public transit agency or authority | 277 | Two-month pilot in summer 2019 | 2 | 2,069d | Directly operated | - | [Did not answer] |
| Warwickshire County Council (UK) | One zone | A local or regional public transit agency or authority | 833 | May 2020 | 4 (100%) | 38 | Contracted service | - |
|
a. The survey asked for the number of riders in the past year, or, for services operating less than one year, the number of riders since implementation.
b. “Other demand response” refers to a traditional Dial-A-Ride service or paratransit service, if separate from microtransit service.
c. Other service in the county is contracted.
d. Includes 438 vehicles operated by contracted services.

One agency designed its zone to include all stops on the deviated fixed route it planned to discontinue: a Walmart and other retail outlets, a hospital and related medical services, and senior and low-income housing.
When asked how they planned their microtransit service, a majority of agencies highlighted the use of data and public and stakeholder outreach. Agencies reported using data such as disadvantaged areas based on Census data and data from regional organizations, such as their local planning commissions and nearby transit authorities. Multiple agencies conducted long-range plans or microtransit feasibility studies to determine their service parameters. Many agencies reported conducting extensive outreach, including focus groups, surveys, and stakeholder meetings. Some heard from riders that they wanted more spontaneous transit or an improved level of service.
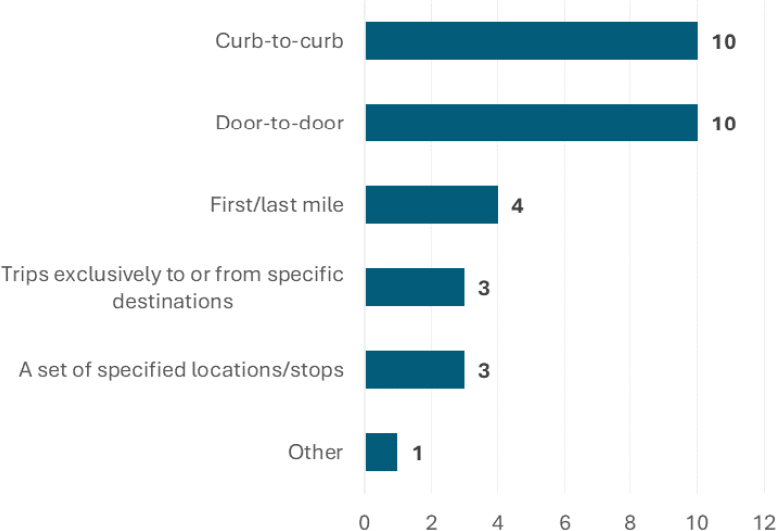
All agencies operate either curb-to-curb or door-to-door microtransit (Figure 3). With curb-to-curb service, the app may instruct the rider to walk to the nearest intersection to provide a more efficient pick-up location for the driver. Door-to-door service refers to services that pick up a rider directly where they request a ride. Some agencies report offering both; they provide door-to-door service to riders with mobility challenges. Moray Council in Scotland is starting a service that will allow groups of up to 14 riders to book a multi-pick-up/drop-off service to secure a complex journey pattern for employee journeys, health and social care groups, education bodies, and local support groups. Four agencies (22 percent) prioritize specific passenger groups when booking, including older adults, ADA, and passengers going to dialysis and other medical treatments. Three U.S. agencies prioritize passenger groups; two agencies replaced paratransit service with microtransit, and one agency did not replace paratransit but encourages ADA riders to use microtransit.
Service Models and Fleet Considerations
As indicated in Table 3, all U.S. agencies reported that they directly operate their service (i.e., do not contract, such that the technology vendor operates the service), including one agency that said it would prefer to operate a fully contracted service but cannot afford it at the current cost with federal 5311 (Formula Grants for Rural Areas) funding. The primary factors in deciding a service model were cost and staff/agency expertise, each selected by 12 agencies (Figure 4).
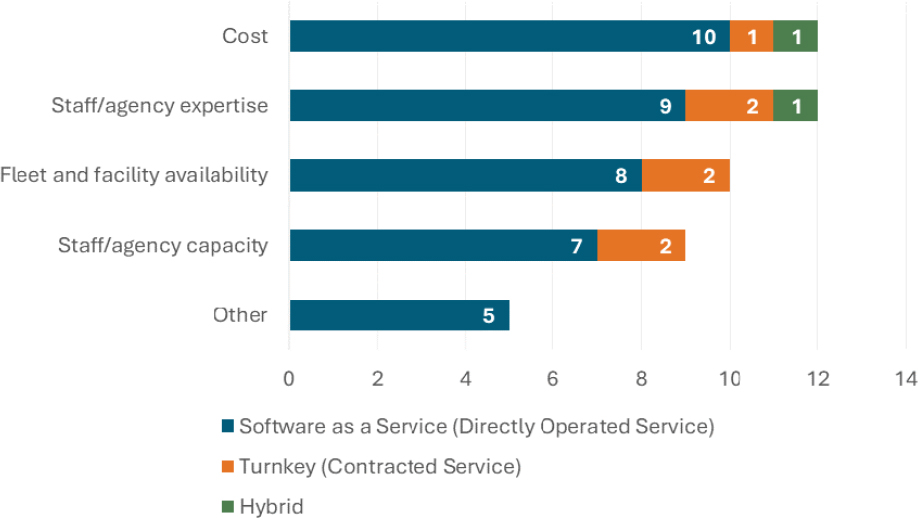
The next most important factors were fleet and facility availability and staff/agency capacity. Other factors mentioned included wanting to provide customer service, retaining infrastructure and resources in case microtransit didn’t work for the community, and wanting full control of the service.
Four microtransit services in the United States (31 percent of responding U.S. agencies) are run by operators who are members of a union. No agencies experienced any issues with implementing microtransit service based on the concerns of union members or leadership, and multiple agencies reported involving union members throughout the whole process—from helping select a vendor, to helping determine app and software capabilities, to providing feedback during the pilot period.
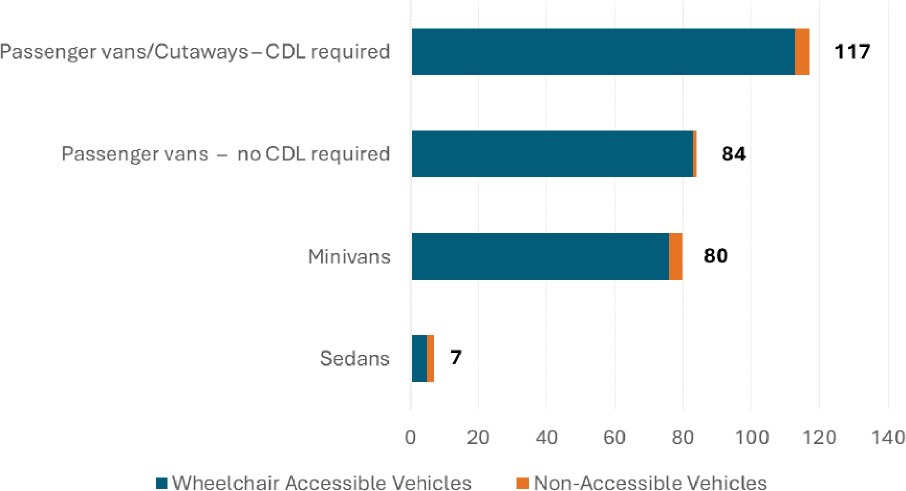
As shown in Table 3 and Table 4, survey respondents indicated that a majority of vehicles they use to operate microtransit services are wheelchair accessible. Among responding agencies, 12 agencies operate passenger vans that don’t require a commercial driver’s license (CDL), nine agencies operate passenger vans or cutaway buses that require a CDL, nine agencies operate minivans, and two agencies operate sedans. The majority of the responding agencies reported that their fleets include passenger vans or cutaway buses that require the driver to have a CDL (Figure 5).
As part of its visioning process, one agency reported spending a year holding focus groups with riders, community partners, county and city officials, and medical personnel to develop goals for the service. Another agency reported identifying concerns with its existing software to prioritize features based on the relative cost of each of the concerns.
Visioning, Goals, and Performance Metrics
Eleven agencies (58 percent) underwent a visioning process before establishing their microtransit service. Agencies that did not undergo a visioning process reported having goals in mind but no formal process of adopting goals from a microtransit feasibility study. Agencies shared their goals for the service in an open-ended question. The responses are organized by theme as follows:
- Ridership
- Increase ridership.
- Attract new riders while maintaining current ridership.
- Access
- Expand transit access for service and hospitality industry workers.
- Improve access for individuals who live in the more rural areas of the county.
- Operations and efficiency
- Reduce operator downtime.
- Transition to smaller, more efficient vehicles.
- Decrease the amount of time trip schedulers are on the phone with customers.
- Reduce operating costs.
- Eliminate one scheduler/dispatcher position.
- Level and quality of service
- Increase quality of life for older adults and persons with disabilities through offering same-day service seven days a week.
- Provide flexibility by allowing people to book and pay for trips via an app.
- Maintain on-time performance.
- Meet 100 percent of ride demand during operating hours.
- Improve customer satisfaction.
To establish performance metrics, agencies reported analyzing past and current performance, using best practices from peer agencies, and using the same metrics as their demand response service. Performance metrics, including current performance and goals, are listed in Table 5. (The survey asked agencies to list their current performance. Agencies filled out the survey between March and mid-April 2024.) In the table, maximum load refers to the maximum number of passengers who can ride in the vehicle at one time, and average vehicle count refers to the number of vehicles in service at any given time. Ten agencies (56 percent of 18 respondents) reported that they have adjusted their service in response to performance. This includes adding additional terminals and hubs to reduce deadhead miles, hiring new drivers in some areas to maintain short wait times and high on-time performance, and adding vehicles to accommodate more riders and reduce the number of trip requests it is unable to book.
Procurement and Funding
Fifty-three percent of agencies used a request for proposals (RFP) to procure their microtransit technology (Figure 6). Two agencies, both international agencies, had already used technology for a different demand response service and did not undergo new procurement. Among U.S. agencies, 69 percent used an RFP and 16 percent were sole sourced. Two U.S. agencies (15 percent) listed the technology vendor in a grant application as a partner.
Most agencies (56 percent) established performance metrics to evaluate the software vendor’s performance. Among agencies that did, reasons included wanting software that would be able to grow with them and adding new features unique to rural transit. One agency reported establishing metrics such as number of service outages, number of unfulfilled journey requests, and passenger trips per hour.
The most common sources of funding are state (or provincial) funds and federal (national) government funds (Figure 7). Of U.S. agencies, 85 percent use federal funds and 85 percent use state funds. The next most common sources are local funds (69 percent of U.S. agencies) and fare revenue (54 percent). One agency reported using contract and advertising revenue, and one agency created a nonprofit that allows the service to tap into funds that were previously not available to it.
Trip Booking and Technology
For a service to be considered on-demand microtransit, it must offer a smartphone application for trip booking, among other functionalities. While all the survey respondent agencies
Table 5. Performance metrics—current performance and goals.
| Agency (Monthly Ridership) | Passenger Trips per Hour | Cost per Passenger Trip | Maximum Load | Average Wait Time | Average Trip Length | Average Vehicle Count | Customer Satisfaction | |||||||
|---|---|---|---|---|---|---|---|---|---|---|---|---|---|---|
| Current | Goal | Current | Goal | Current | Goal | Current | Goal | Current | Goal | Current | Goal | Current | Goal | |
| Baldwin Regional Area Transit System (8,465) | 2.2 | 2.5 | $28.82 | $27.00 | – | – | – | – | 8.47 min. | 8 min. | 26 | 35 | 4.9 | 4.9 |
| Battle Creek Transit (687) | 1.81 | – | $37.00 | – | 3 | – | – | – | 15–20 min. | – | 2 | – | 9+ | – |
| Bay Area Transportation Authority (9,625) | 2.4 | 2.5 | – | – | – | – | – | – | – | – | – | – | 4.7 | 4.8 |
| Bay Transit (1,490) | * | * | $13.33 | $15.00 | – | – | 18 min. | 15 min. | – | – | 3 | 3 | 4.9 | – |
| Cheshire West and Chester Council (1,487) | 3.72 | 3 | $16.10 | – | 16 | – | – | – | – | – | – | – | 4.9 | 5.0 |
| City of Gainesville / Hall Area Transit (7,340) | * | * | – | – | 3 | 6 | 15 min. | 15 min. | 5 miles | 5 miles | 9 | 15 | 4.9 | 5.0 |
| Heart of Iowa Regional Transit Agency (6,604) | * | – | $37.50 | – | – | – | 6.2 min. | – | 12.2 min. | – | – | – | 4.9 | – |
| Hertfordshire County Council (3,189) | 2.38 | 2 | – | – | – | – | – | – | – | – | 7 | 7 | 95 | 97 |
| Mountain Empire Older Citizens (4,333) | 3.2 | 4 | $8.06 | $7.50 | 8 | 8 | 10 min. | 8 min. | 6 miles | 5 miles | 4 | 5 | 4.94 | 5 |
| North Central Regional Transit District (1,165) | – | – | $30.25 | – | – | – | – | – | – | – | 6 | – | – | – |
| PICK Transportation (1,811) | * | – | * | – | 8 | – | 11.2 min. | – | 4.1 miles | – | 35 | – | 4.5 | – |
| Southeast Vermont Transit (558) | 2.75 | 3 | $27.18 | $25.00 | 8 | 8 | 15 min. | 15 min. | 2 miles | 2 miles | 1 | 1 | 99% | 100 % |
| Town of Great Barrington, MA (1,207) | 2.64 | – | $19.58 | – | – | – | – | – | – | – | 4 | – | 94.1 | 95 |
| YVEDDI Public Transportation (1,389) | 1.9 | 2.5 | * | $10 | – | – | – | 15 min. | 4.71 miles | – | 6 | 6 | 9 | 10 |
YVEDDI = Yadkin Valley Economic Development District, Inc.
*Indicates cases in which data were provided but appeared to be based on assumptions that were different than those of the project team (e.g., total passengers per hour across all service vehicles instead of passenger trips per vehicle hour).
– Indicates no information provided.
Note: GoWake Access Transportation, Moray Council, North Lincolnshire Council, TransLink, and Warwickshire County Council are not shown in this table because they did not respond to the question about metrics results.

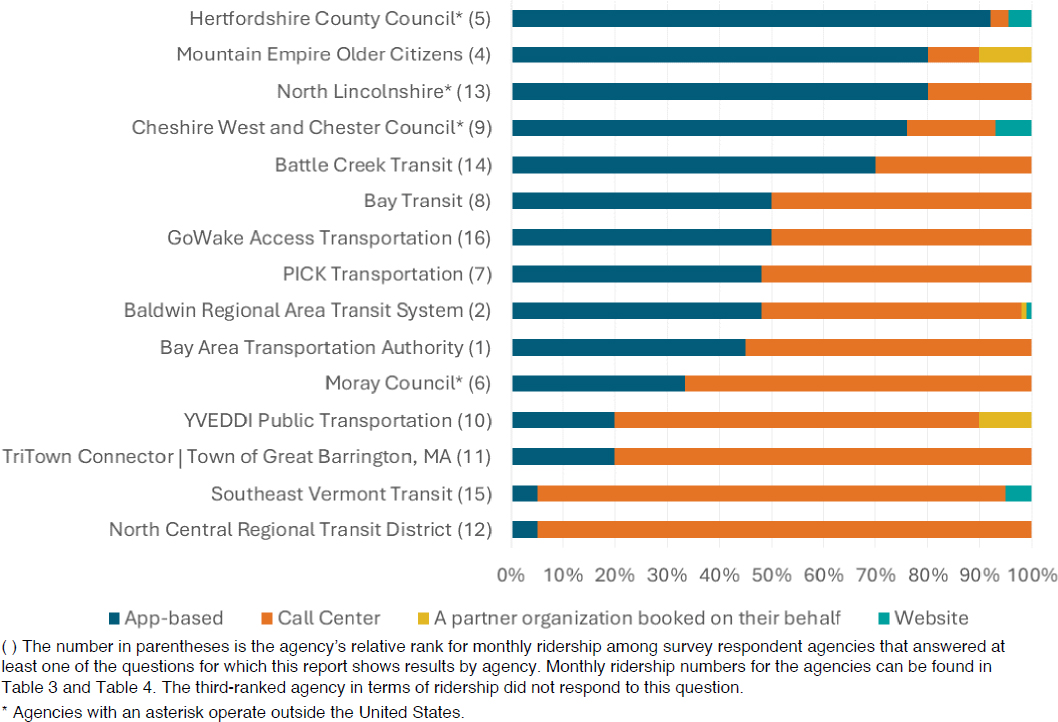
have an app, the proportion of app-based booking varies dramatically—from 5 percent to 92 percent (Figure 8). The average proportion of app-based booking among all survey respondents is 40 percent. Call centers conduct a significant proportion of trip booking: 10 responding agencies (including all but two responding U.S. agencies) report that half or more trips are booked through call centers. Three of the top four agencies in the sample in terms of highest percentage of booking through the app are in the U.K. There is not a strong correlation between agencies’ monthly ridership and percentage of trips booked by app.
The most common reported barrier to app-based booking is riders not being comfortable using a smartphone; this is followed by issues understanding the app interface (Figure 9). Among the agencies with the lowest app-based booking proportion (20 percent or lower), all four reported discomfort using a smartphone as a barrier.


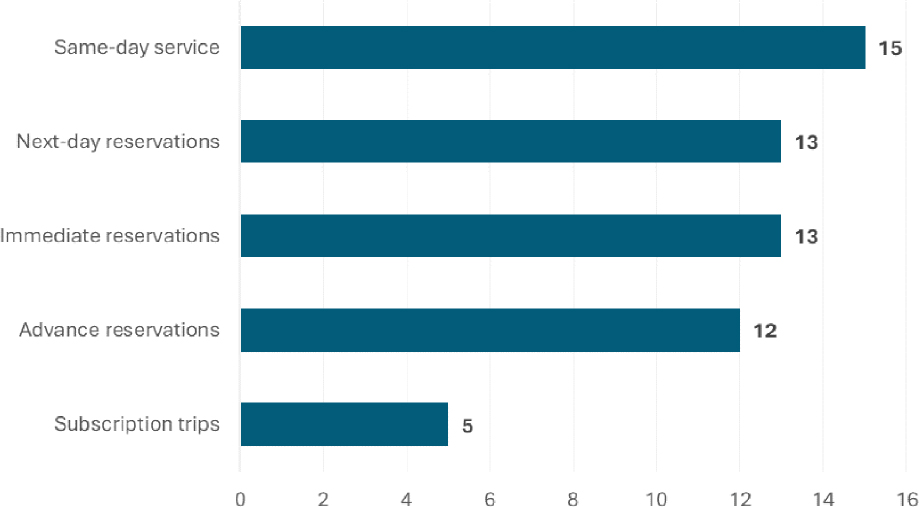
One of the benefits of microtransit service is the convenience it provides to customers by offering immediate service rather than requiring more advance notice. For the purposes of a question about the type of trip reservations available, “same-day service” is service booked a minimum of two hours in advance (but on the same day the passenger wishes to travel), “advance reservations” is service booked at least two days in advance, and “subscription trips” are regularly recurring trips that do not need to be booked each time. Of the 18 agencies that responded to the question, 15 offer same-day service (83 percent) and 13 offer immediate/on-demand service (72 percent) (Figure 10). Of the 12 U.S. agencies that responded to the question, 10 offer same-day service (83 percent) and 11 offer immediate service (92 percent). Two agencies, TransLink and GoWake Access Transportation, reported offering only immediate reservations.
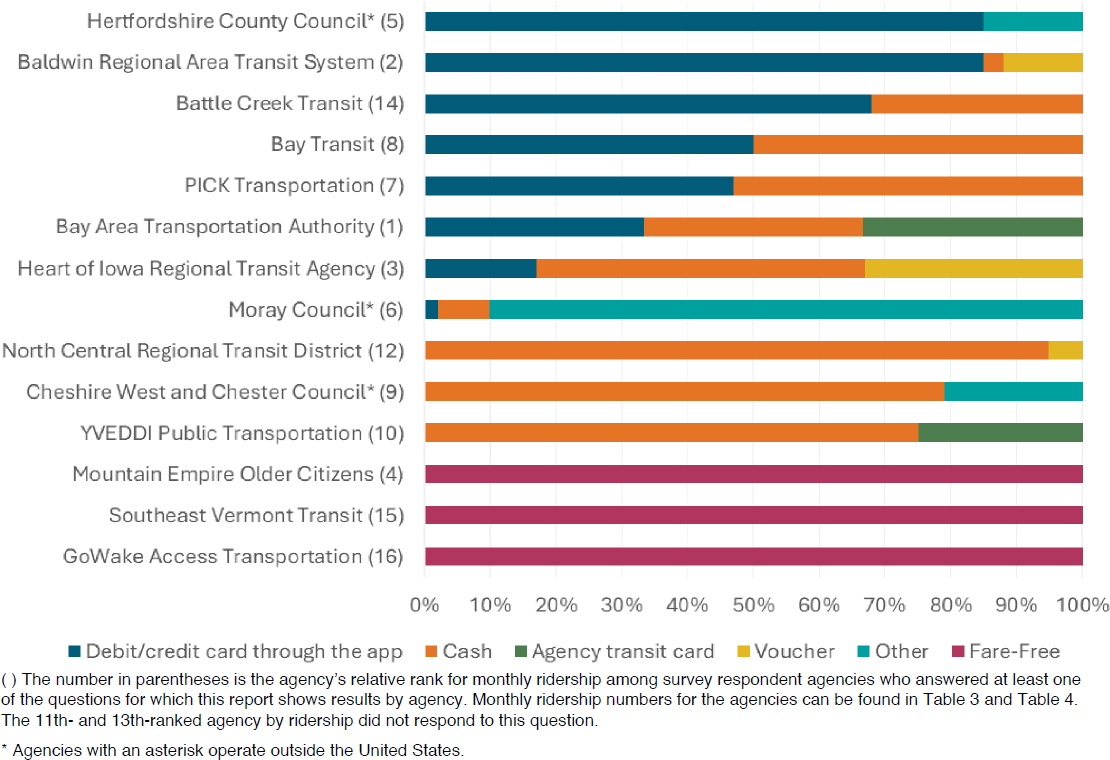
Fare payment methods varied significantly by agency and service. Paying by voucher refers to riders using cash to load money into their account. Eight agencies reported a proportion of fares being paid by a debit or credit card through the app, and six of those have one-third or more trips paid for by a debit or credit card (Figure 11). Six agencies have half or more of their trips paid for by cash. Three agencies operate fare-free microtransit. There is not a strong correlation between app-based or cash payment and ridership.
Marketing and Customer Education
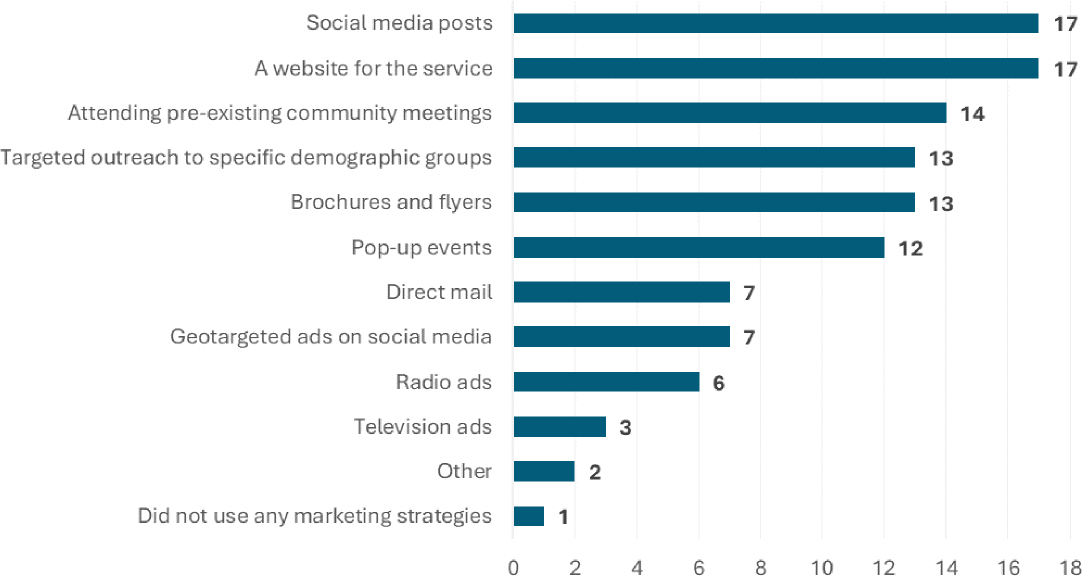
Of the 18 agencies that answered a question about how they marketed their service, 17 used social media posts and a website (Figure 12). Fourteen agencies reported attending pre-existing community meetings, such as civic association or homeowner association meetings to get the word out about the service, and 13 agencies targeted outreach to specific demographic groups and used brochures and flyers. Other strategies include press releases and word of mouth. Agencies reported that the most successful strategies were those in which the agency could speak to members of the public one-on-one; examples provided included attending hands-on clinics, pop-up events, and roadshow events.
To educate customers on how to use the service, agencies opted for in-person training (69 percent), flyers and brochures (63 percent), and how-to videos (56 percent) (Figure 13). Other strategies include driver assistance and call center staff helping to educate the riders.
Ten agencies reported that they devoted over 10 hours per week to marketing the service pre-launch, with 33 percent devoting between 11 and 20 hours weekly (Figure 14). Post-launch, most agencies (59 percent of 17 respondents) devoted less than four hours per week to marketing and education.
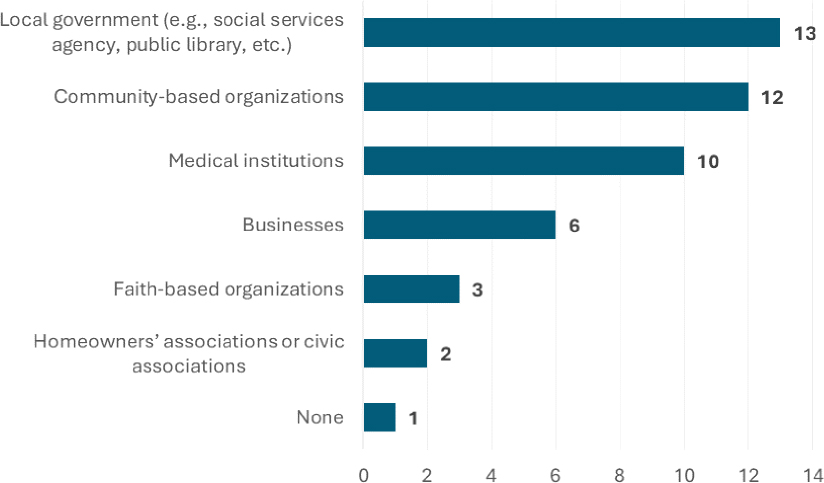
Most agencies reported forming partnerships with local government (81 percent), community-based organizations (75 percent), and medical institutions (63 percent) to support marketing activities (Figure 15). One agency did not partner with any organizations.


Service Benefits and Lessons Learned
Agencies reported highly positive customer feedback regarding their microtransit service. Most agencies reported that riders appreciate the flexibility of the service and using an app to book. Three agencies noted that passengers said the service has been life changing. The biggest concerns from riders are on-time performance and lack of availability of vehicles, resulting in long lead times for bookings or difficulty making a trip due to lack of capacity. Multiple agencies indicated that feedback from drivers and staff was negative at first because offering on-demand service completely transformed how they do their jobs. However, agencies also reported that drivers adapted to the service.
When asked how microtransit service affected their agency’s overall performance, most agencies reported a decrease in cost per passenger trip and improved service efficiency. All agencies reported an increase in customer satisfaction. Agencies saw mixed impacts to total service costs: two agencies reported a higher overall cost, two reported a lower total service cost, and one said total costs have remained stable.
Agencies reported a variety of lessons learned and advice for agencies considering microtransit:
- Implement microtransit in a small geographic area or on a small scale initially and expand the service over time.
- Fully test the technology ahead of time and ensure you understand the software’s capabilities.
- Ensure you have a plan for sustaining the service beyond the pilot period (if it starts as a pilot).
- Implement measures to maintain availability, such as providing strategic deployment and assignment of vehicles to zones, reducing advanced booking periods, and offering alternative times if the first request is unavailable.


