Off-Lake Sources of Airborne Dust in Owens Valley, California (2025)
Chapter: 2 A Systems-Level Understanding for Off-Lake PM10 Sources
2
A Systems-Level Understanding for Off-Lake PM10 Sources
Effective management of dust emissions is supported by a systems-level understanding of the many factors involved in particulate matter emissions. The distribution of potentially emissive particles and their movement depend on multiple processes (e.g., geology, climate, hydrology, ecology) that vary across spatial and temporal scales, and the interaction of multiple landscape features (e.g., rivers, lakes, playas, alluvial fans, sand dunes). This chapter discusses the factors and processes influencing PM10 emissions in the Owens Valley Planning Area (OVPA) followed by important context associated with key elements of the system, including geology, climatology, meteorology, hydrology, vegetation, and communities.
OVERVIEW OF CONTROLS OVER OWENS VALLEY PM10 EMISSIONS
In the OVPA, multiple factors affect PM10 emissions over space and time, including geology, climatology, meteorology, hydrology, and vegetation (Figures 2-1, 2-2, and 2-3). Humans are also an important part of this landscape because Tribal and other local communities depend on the local ecosystem for food and water, along with recreational, economic, and cultural resources; as such, these anthropogenic influences can affect PM10 emissions. The valley also has a long history of pre-colonial Tribal water distribution and ecosystem stewardship in addition to water diversions from the Owens Valley over the last century.
Broadly, Owens Valley reflects millions of years of evolution in the geological, climatological, hydrological, geomorphic, and ecological sub-systems in the region, with interconnected and often interdependent landscapes and features. For these reasons, land use and natural resource managers continue to face steep challenges when tasked with restoring landforms or ecological sub-components within broader, dynamic landscapes, particularly in the context of climate change.
GEOLOGICAL CONTEXT
The landscape of the Owens Valley is a basin-and-range valley similar in some ways to other settings in the southwestern United States with broad valleys bounded by near parallel, north-south oriented mountain ranges. This type of landscape is the product of crustal extension over millions of years to produce faults and blocks of the Earth’s crust that shift in orientation (tilting) and relief (elevation) relative to one another over relatively short distances (Eaton 1982). The Owens Valley is a fault-bounded depression, or graben, flanked by uplifted and tilted

__________________
a This figure was updated after release of the report to make corrections to geologic features.
crust of the southcentral Sierra Nevada Mountains to the west, the White-Inyo Range to the east, and the Coso Range to the south and east.
In terms of overall relief, the Owens Valley is among the deepest valleys in the United States, with an elevation difference of roughly 10,500 ft (3,200 m) between the valley floor and Mount Whitney, the tallest peak on the west side, which stands at 14,500 ft (4,420 m). Thus, drainage basins that connect water and sediment flows from the mountains to the valley floor are typically very energetic and have been for millions of years. Even prior to water diversion, Owens Lake had been relatively shallow due to high rates of sedimentation from erosion of nearby mountain ranges and sediment delivery from the Owens River. Because of its shallow nature, the effects of climatological changes are amplified at the lake.
For about 2.6 million years, Earth’s climate has been oscillating between warm and dry interglacial periods and cooler and wetter glacial periods due to changes in Earth’s orbit and axis (Milankovitch 1941). The Sierra Nevada was largely glaciated during the cooler and wetter periods (Basagic and Fountain 2011), which led to increased runoff and high water levels that would periodically overflow into neighboring chains of lakes (Bacon et al. 2020; Gale 1914). Overflow water from the paleo-Owens Lake likely stopped 11,000 to 12,000 years ago (Rosenthal
et al. 2017), when it became a terminal lake (Bacon et al. 2006, 2018; Benson et al. 2002; Li et al. 2000; Smith, Bischoff, and Bradbury 1997; Smoot et al. 2000). Between 1872 and 1878, Owens Lake was a closed basin lake spanning more than 108 square miles (280 km2) with a water depth of 48.9 ft (14.9 m) (Gale 1914; Lee 1915). Major water diversions began in 1913 after the construction of the Los Angeles Aqueduct system. By 1931, Owens Lake had largely evaporated, leaving a remnant brine pool and the playa environment known today (Smith, Bischoff, and Bradbury 1997). The result of this geologic history is a complex and continually evolving spatial mosaic of different landforms in the valley fill deposits that were produced and are reworked by slope (colluvial), riverine (fluvial and alluvial), wind (aeolian), and glacial actions. In one location there may exist layers of deposits that vary in particle size, composition, and depositional structure based on differences in their origin. Thus, the Owens Valley landscape is composed of a mosaic of different surface types with differing potential to produce dust.
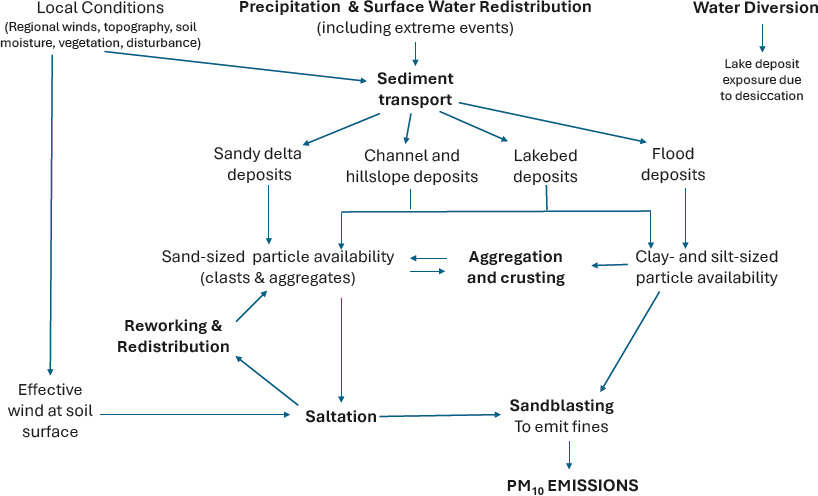
Dust Emission Processes
Dust emission occurs when the shear force exerted on a particle exceeds the forces attaching the particle to the surface (such as gravitational or electrostatic forces). Sand-sized particles from 63 to 100 micrometers have the lowest threshold shear speeds, and therefore, if they are present, these “efficient saltators” are the first to move, undergoing “saltation,” or movement in arc-shaped hops within a few centimeters of the surface (Figure 2-4) (Bagnold 1941; Gillette et al. 1997). These particles can be single clasts or aggregates of smaller particles. Saltators ejected from the surface follow ballistic trajectories before falling back to the surface, where they strike other particles and/or disaggregate into finer particles. The impacted particles, if similarly sized or larger, can “creep” or roll along the surface, whereas smaller particles (including PM10) may be ejected either from within the surface

NOTES: The arrows on the left represent the logarithmic decrease of wind speed toward the bed surface. Larger particles move in creep mode; fine and medium sand-sized particles move by saltation mode, and smaller particles enter suspension where they are transported away. Image is not to scale.
SOURCE: Zobeck and Van Pelt (2011).
sediment matrix or as fragments from colliding particles. These finer particles can be entrained into the turbulent air stream in “suspension” (i.e., “dust” or “emitted PM10”; Figure 2-4; Bagnold 1941). Thus, if particles capable of saltation and emission as PM10 are present, dust emission can occur on any surface, including natural surfaces around the lake. The amount of dust emission flux (Fd) from a surface is proportionate to the saltation flux (Q), both of which are a function of the wind shear velocity (u*) at the surface. Generally, the volume of fine dust particles emitted from a surface by saltation takes the form, Fd ∝ u*i, where i = 3 for harder crusted surfaces and i = 4 for soft, loose sand or soil surfaces (Lu and Shao 1999; Sweeney 2022). Dust emission is a natural process in semiarid landscapes with competent winds and sufficient particles for saltation and suspension. Although direct aerodynamic entrainment of dust-sized particles without saltating sand is possible, it is believed to be relatively rare on natural surfaces with varying roughness elements (e.g., plants, mixed sediments, dunes) and soil moisture conditions (Sweeney 2022).
Potentially Emissive Landforms
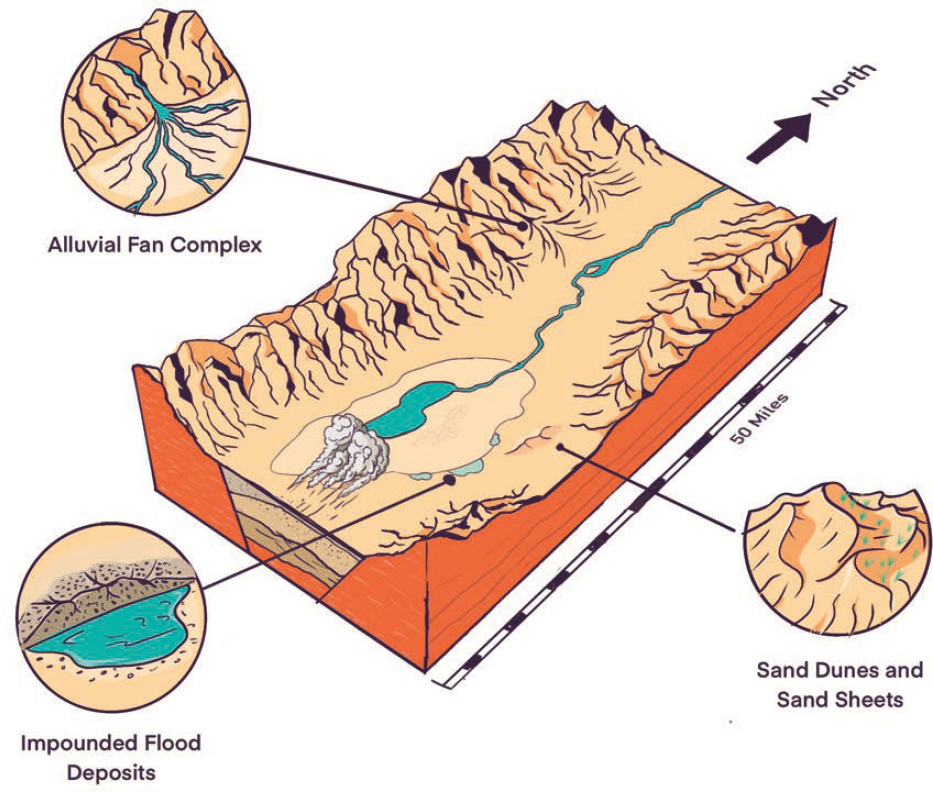
Surface water has the potential to move both fine dust-sized particles and larger sand- and gravel-sized particles. This is particularly true in overland and channelized floodwaters moving from the mountain front down toward the bottom of the valley. During higher energy flood events, particles of all sizes (including boulders) can be transported by water, with larger particles deposited on the upper alluvial fans and finer particles moved to more distal reaches of alluvial fans and onto the valley floor. Thus, the distal edges of alluvial fans tend to be finer grained than areas closer to the mountain fronts, and fans generally tend to be composed of clasts too large to be moved by wind. In lower energy situations, such as during small flow events or during the waning stages of higher magnitude floods when the flow slows, finer particles carried by the water will settle out. This can happen in the channel or in localized depressions behind natural or anthropogenic impoundments where water pools and deposits fine material capable of producing dust once the area dries. Thus, although alluvial fans are typically made of clasts too large for wind to move, channels inset in fans and distal areas of fans often contain a mix of particle sizes, including those moveable by wind through saltation and suspension, creating areas within the fan that may experience considerable aeolian transport and PM10 emission.
Fine, dust-sized particles (i.e., clay and silt) may also be transported to lower energy environments, like standing water and lakes. These fine-grained lacustrine sediments can be quite cohesive, with little ability to produce dust without a disturbance to break up the soil crust. This is particularly true if binding agents (such as salts or clays) or biological crusts are present (see review and citations in Sweeney 2022). In cases where a mixture of dust- and sand-sized particles were deposited (e.g., where channelized flow empties into the lake), removal (i.e., winnowing) of fines by aeolian transport can produce a coarse sandy lag deposit with reduced ability to produce dust. This appears to be the case throughout much of the valley bottom, although areas still exist that are clearly capable of producing dust under strong winds. Similarly, most of the beach deposits found around the paleo-Lake Owens would likely have been comprised of sand- to cobble-sized clasts. However, in the millennia since the deposition of these beach deposits, the strong winds of the Owens Valley have largely removed sand-sized particles, leaving behind larger clasts immovable by wind. Nonetheless, beach ridges can produce localized depressions landward of the shoreline that are well suited as depositional basins for impounded floodwaters and other processes that deposit dust-producing sediments.
Sand dunes are typically produced from aeolian reworking of sand deposits that were initially delivered by fluvial or lacustrine processes. In the case of the Owens Valley, this process of dune formation can include sand delivery to the lakebed and channel floodplains by the Owens River and in-lake, wave-driven littoral currents that create sandy beaches, that are then re-mobilized by wind and re-deposited into dune forms downwind. Through saltation (Figure 2-4), winds competent to transport sands are also capable of mobilizing and producing finer silt- and clay-sized particles, which become deposited within dunes and associated vegetation communities. Thus, dune ecosystems are naturally capable of both storing and providing fines capable of emission as dust (Bullard and Baddock 2019; Sweeney 2022; Sweeney, Lacey, and Forman 2023). Depending on the wind regime, sand supply, and vegetation cover and type, aeolian sands can be deposited as unanchored “free” dunes (e.g., barchans, transverse dunes) or as “anchored” dunes associated with shrubby vegetation, such as parabolic dunes (Goudie 2011) or nebkhas
(also called “coppice dunes”; Hesp and Smyth 2019; Lancaster and Bacon 2012). Vegetated dunes are typically poor dust producers because the vegetation reduces the mobility of saltators by reducing wind shear at the surface. However, vegetated dunes also serve as sinks for dust-sized particles over time either through direct capture of suspended fines by plant canopies, atmospheric (wet or dry) deposition, fluvial or pluvial deposition of fines within interdune depressions, or in situ production of fines (Bullard and Baddock 2019; Sweeney 2022). Saltating particles can sandblast vegetation, damaging or even killing it, and the loss of fines associated with dust emission can reduce important soil resources including cation exchange capacity, water holding capacity, soil nutrients, and plant seeds (Okin, Gillette, and Herrick 2006). These impacts can destabilize vegetated dunes causing re-mobilization of the underlying sand dunes, which not only liberates saltators but also exposes dust-sized particles in the newly mobilized dune field to sandblasting and emission. In the case where large amounts of fines were deposited within the dune field while it was stabilized, the dunes could become significant sources of dust indefinitely.
Sandy surface soils are not always formed into sand dunes by wind; they can also form extensive sand sheets. Active sand sheets differ from sandy soils mainly by their limited organic content and presence of ripples, which reflect frequent transport of sand grains by wind. Sand sheets tend to form not only where there is a significant source of sand, but also in areas where either wind power or sand supply is too low to create dunes. In addition, Kocurek and Nielson (1986) indicate other local factors that are often associated with sand-sheet development, including: a high water table, surface cementation or binding, periodic flooding, significant coarse-grained sandy sediment supply, and vegetation cover. For example, the sand sheet above Keeler Dunes that is moving up the Slate Canyon fan appears to exist under conditions of relatively low sand supply (mostly coarser-grained sands), periodic flooding, and sparse vegetation cover. This results in a thin layer of sand over the modern, coarser (gravel-cobble dominated) alluvial fan. Alternatively, a sand sheet might be a transient landform caused by recent exposure of considerable sand without sufficient time for transport into an organized dune field and/or other constraints that would limit the development of dunes. The northern sand sheet on the Owens Lake bed northwest of the Keeler Dunes appears to be such a landform. This area, rich in sand, forms a part of the Owens River delta in Owens Lake and the morphology of sand deposits here reflect conditions imposed by a high water table in the valley bottom, periodic flooding, availability of coarser sands (alluvial deposits of the Owens River), and the presence of binding salts. The relatively recent exposure of this deposit following diversion of water from the lake provided a sudden increase in the abundance of sand available for transport prior to dust control efforts.
CLIMATOLOGY AND HYDROLOGY
High winds and precipitation affect dust emissions in the OVPA. In the Owens Valley, high winds are frequently aligned with the axis of Owens Valley and are either from south-southeasterly or north-northwesterly directions (Zhong et al. 2008). About 40 percent of wind events over 7 m/s (16 mph) occur in the spring (March–May), about 24 percent in fall (September–November), and less than 20 percent in winter (December–February) or summer (June–August; Zhong et al. 2008). Extreme high wind events over 18 m/s (40 mph) tend to occur only a few times a year (Zhong et al. 2008). Cross-valley westerly high wind events occur less frequently but are the strongest wind events with the longest duration of sustained winds and are related to some strong dust events (Jiang, Liu, and Doyle 2011; Serafin, Strauss, and Grubišić 2017).
The crest of the Sierra Nevada in the Owens Valley region receives more than 30 inches/year (in/yr) of precipitation, with the majority occurring from October to April and small amounts falling during summer thunderstorms (Danskin 1998). The Sierra Nevada Mountains produce a rain shadow effect that results in the Owens Valley being substantially drier than the western side of the Sierras, so that the Inyo and White mountains only receive 7–14 in/yr of precipitation. The annual precipitation on the Owens Valley floor varies from 6 in/yr in the north end of the OVPA to approximately 4 in/yr around Owens Lake. Precipitation also varies with elevation, with higher elevations receiving substantially more rain than lower areas (Danskin 1998). Although precipitation is generally low in the Owens Valley, water flow from the Sierra Nevada due to snowmelt can be substantial (Hollett et al. 1991). Higher rainfall years can enhance vegetation cover and reduce dust generation, while drought can decrease vegetation cover and increase dust generation (Elmore et al. 2008). Precipitation patterns also can influence soil moisture, with drier surfaces being more emissive (Sehmel 1980).
Alluvial transport of sediments is frequently associated with extreme precipitation events that cause flooding, creating new emissive surfaces (Elmore et al. 2008). In the Owens Valley, such flooding can occur due to high and rapid snowmelt from the Sierra Nevada, or from infrequent, but intense precipitation from thunderstorms, atmospheric rivers, or tropical storms (Kim and Lowe 2004; Sahagun 2024). For example, the remnants of Tropical Storm Kay brought flash flooding during a brief but high-intensity event that impacted Owens Valley in September 2022. Recorded rainfall totals ranged from 0.22 to 1.06 inches in the immediate area around Owens Lake (National Centers for Environmental Information 2025). However, due to the observed spotty nature of rainfall and the sparse network of rain gauges in this area, higher amounts of rainfall than recorded at the gauges could have been possible. In August 2023 during Tropical Storm Hilary, weather stations around Owens Lake recorded 24-hour precipitation totals ranging from 2.25 to 5.39 inches (GBUAPCD 2023). To put these into perspective, the average annual rainfall at nearby Bishop Airport is 5.13 inches (National Centers for Environmental Information 2025).
Groundwater also has strong effects on dust emission potential by altering soil moisture, soil chemistry, soil fertility, and the type and extent of vegetation cover (Elmore et al. 2008; Goedhart and Pataki 2011). Groundwater is particularly important in the lower Owens Valley, where most streams are now diverted into the Los Angeles (LA) Aqueduct, and do not directly flow into the valley (Danskin 1998). Nearly all groundwater in Owens Valley is stored in the saturated valley fill because the bedrock that surrounds and underlies the valley fill is virtually impermeable (Hollett et al. 1991, 1989). Given the low rainfall on the valley floor itself, nearly all the recharge to the aquifer system is from infiltration of runoff from snowmelt and rainfall on the Sierra Nevada. Groundwater flows from the margins of the valley toward the center and then to the south from the Bishop basin (outside the OVPA) to the Owens Lake basin (Hollett et al. 1991).
Groundwater use in Owens Valley to the north of Owens Lake has changed over the decades (Danskin 1998). Prior to 1913, groundwater tables in Owens Valley were generally high and supported dense vegetation, and canals were used to decrease water levels in some areas to allow for agriculture. Between 1913 and 1969, the extensive surface water export through the LA Aqueduct led to severe water limitations in Owens Valley, causing many farms and ranches to cease operations, but groundwater was only occasionally pumped. In the early 1970s, groundwater levels and the acreage of native vegetation it supported were estimated to be similar to 1912–1921 values (Griepentrog and Groeneveld 1981). The opening of the second LA Aqueduct in 1970 increased export capacity from the Owens Valley by 60 percent and led to a 5-fold increase in groundwater pumping from the valley floor (Danskin 1998; Elmore, Mustard, and Manning 2003), resulting in a 35 percent reduction in native plant evapotranspiration and near elimination of some spring discharges. Large, more widespread changes in depth to groundwater were seen during the droughts of the 1980s and 1990s (LADWP and County of Inyo 1990a) with groundwater extraction peaking in 1987 and 1988 at approximately 240,000 m3/yr (or 190 acre-feet per year; Elmore, Mustard, and Manning 2003). Decreases in spring flow and evapotranspiration served to buffer declining groundwater levels along the Owens Valley floor, but larger groundwater table declines occurred along the western alluvial fans and near well fields (Danskin 1998). From 1986 to 1992, 41 of the 171 piezometers in Owens Valley from Lone Pine to Bishop showed a decline in the water table from 3.3 to 6.6 ft (1 to 2 m); 31 wells declined from 6.6 to 13.1 ft (2 to 4 m); 12 wells declined >13.1 ft (4 m), with the greatest decreases in groundwater levels occurring near the areas of greatest pumping (Figure 2-5; Elmore, Mustard, and Manning 2003).
In 1990, a groundwater management plan—the Long-term Water Agreement—was implemented following a series of disputes surrounding alleged environmental harm from water diversion from the valley (LADWP and County of Inyo 1990a). Since this agreement was reached, groundwater withdrawals have been managed to minimize vegetation impacts, and groundwater levels have fluctuated without a long-term directional trend (Figure 2-6), although modeling by Danskin (1998) suggests that full recovery to pre-1970 groundwater levels in the OVPA north of Owens Lake has not been reached. During the 2012–2016 drought the Los Angelos Department of Water and Power (LADWP) reduced groundwater pumping below that permitted by the Long-term Water Agreement, and groundwater levels did not drop as steeply as during the 1986–1992 drought. Groundwater levels were able to recover after a few years in most wells (Owens Valley Groundwater Authority 2021). In 2022, 46 percent of groundwater extraction was used for irrigated agriculture in Owens Valley; 33

NOTES: The graphs in the upper right are the annual average percentage of live cover for each change classification in C). DTW, Precip, and NoChg designate change classes representing depth to water dependent changes, precipitation dependent changes, and static vegetation conditions, respectively.
SOURCE: Elmore, Mustard, and Manning (2003).
percent for managed vegetation and wetlands; 14 percent for municipal and domestic uses; and 7 percent for Tribal use and unspecified LADWP uses (Owens Valley Groundwater Authority 2024).1
In contrast to the changes up the valley, the vicinity of the lake (also known as the Owens Lake Management Area under the Sustainable Water Management Act) has seen lower levels of groundwater pumping (Owens Valley Groundwater Authority 2021).2 Perennial and seasonal springs and seeps continue to ring the regulatory shoreline of Owens Lake (Figure 2-7), with measured water table depths varying seasonally by 0 to 5 ft (0 to 1.5 m; LADWP 2012; Victor Harris personal communication, July 30, 2024) and by as much as 15 ft across years (Figure 2-8). This and other evidence (Meyers et al. 2021) indicate generally stable groundwater levels near the Owens Lake regulatory shoreline despite the diversion of the Owens River and the groundwater pumping occurring up-valley.
___________________
1 This paragraph was edited after release of the report to correct information about groundwater pumping.
2 This sentence was edited after release of the report to clarify the geographic area described.

NOTES: V016GB is near Fish Springs; T001 is near Independence; V257 is south of Independence; T362 is north of Lone Pine. See map in OVGA 2021. “Trusted” measurements refer to measured water table elevations considered reliable and accurate, in contrast to elevations that were measured when the monitoring well was dry. Most locations show fluctuating groundwater levels without a long-term directional trend. As noted by the text, major increases in groundwater pumping from the valley floor occurred in 1970, prior to these data. At the bottom of the graphs, orange bars denote dry years, and blue denote wet years.
SOURCE: Owens Valley Groundwater Authority (2021).

SOURCE: LADWP (2012).
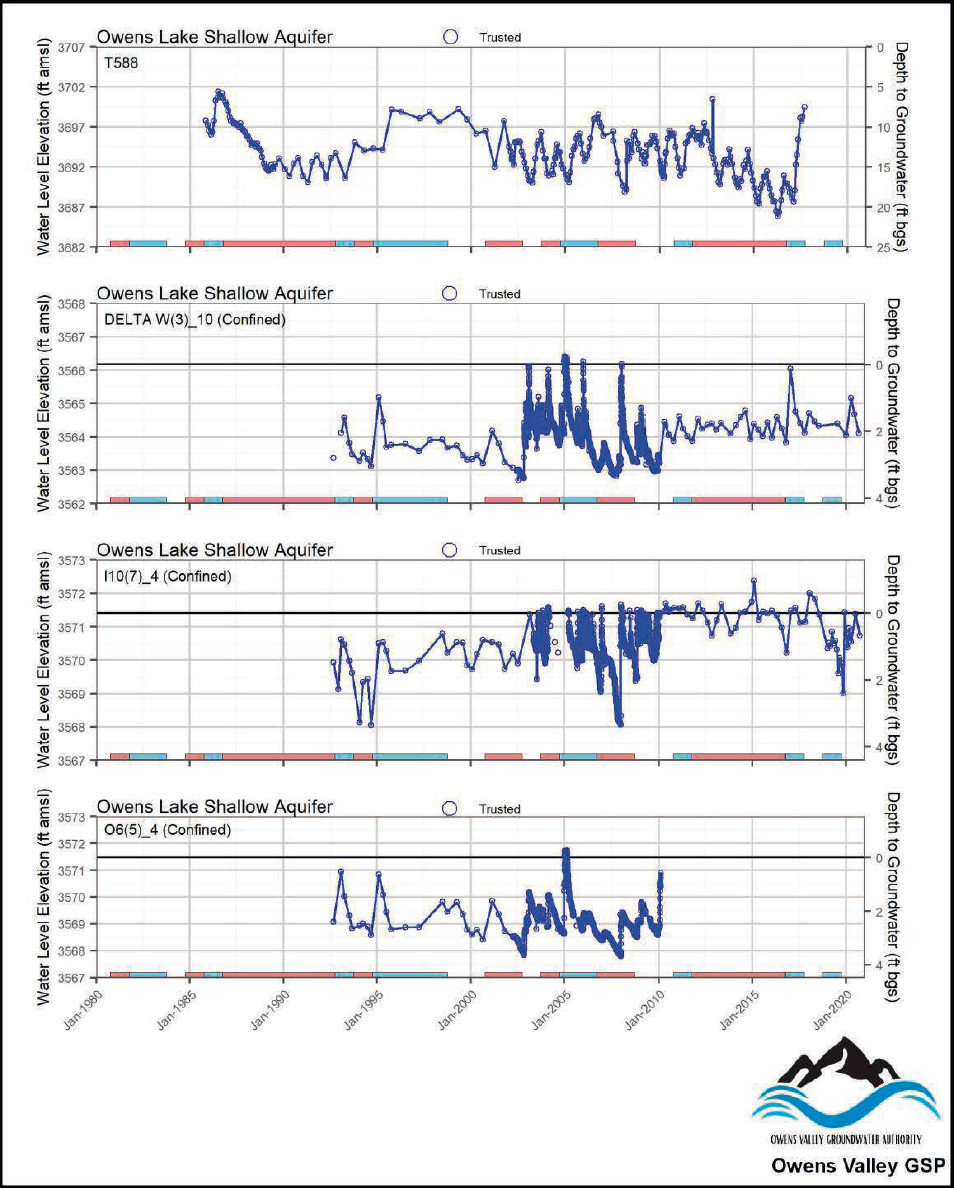
NOTES: Most locations show fluctuating groundwater levels without a long-term directional trend. The top site represents water levels for a single well screen from 30 to 40 ft below the ground surface, and the others denote data from shallow piezometers screening between 3 to 10 feet below the ground surface. T588 and DELTA W(3)10 are north of the lake; I10(7)4 is east of the lake; and O6(5)_4 is south of the lake (see map in Owens Valley Groundwater Authority 2021). At the bottom of the graphs, orange bars denote dry years, and blue denote wet years.
SOURCE: Owens Valley Groundwater Authority (2021).
VEGETATION DYNAMICS
Vegetation impacts dust emission and deposition. For example, vegetation increases the surface roughness, thereby reducing wind shear speed at the soil surface, which in turn reduces dust emission (Okin, Gillette, and Herrick 2006). Vegetation can also entrap dust and sediment from the air (Raupach et al. 2001). If changing conditions lead to lower vegetation cover, previously vegetated soils have the potential to be considerable sources of airborne dust, and decomposing organic matter can form dust-sized particles that are relatively easy to suspend in the airflow due to their low density. Additionally, the incursion of invasive species can impact the local ecology and in some cases may lead to reduced vegetation cover or increased disturbance to the ground. For example, Russian thistle (Salsola sp.) is reported to be commonly found in ditches, roadsides, and cattle grazing areas east of Owens River. Because it is an annual plant, it does not contribute to sustained stabilization of the landscape, and concerns have been raised that tumbleweeds from this thistle disturb the ground, leading to increase dust emissions (Mel Joseph, Lone Pine Paiute Shoshone Tribe, personal communication, August 2024).
Soil salinization has the potential to control vegetation cover, but soil in Owens Valley is generally not saline enough to limit the existing vegetation, except in unique topographic situations that allowed for high deposition and low resuspension of dust (Quick and Chadwick 2011; Reheis 1997). Instead, water availability is the key driver of vegetation composition and management in the Owens Valley (LADWP and Ecosystem Sciences 2010). Access to groundwater can be especially important in Owens Valley, where evapotranspiration from the valley floor is 3- to 6-fold greater than precipitation (Hollett et al. 1991). Upland plant communities, such as dryland/xeric scrub, are dependent on precipitation because their roots lack access to deep groundwater and tend to have low percent cover (median = 6 percent) and high variability from year to year. These areas with deep groundwater are dependent on precipitation and horizontal redistribution of water by hillslope hydrologic processes, making them susceptible to drought (Elmore, Mustard, and Manning 2003). In contrast, areas with high groundwater levels near seeps and springs support wetland vegetation and areas with groundwater depths of up to 16 ft can support deep-rooted plants, termed phreatophytes, which can access groundwater directly (Cooper et al. 2006). These groundwater-supported plant communities, such as high-groundwater alkali scrub and alkali meadows, have higher and more stable plant cover (Richards et al. 2022). The varying groundwater depths in the Owens Valley give rise to different ecological communities (Figure 2-9), which impacts dust emission because groundwater-dependent vegetation has a higher percent cover than upland vegetation types (Richards et al. 2022). For example, one study showed approximately 30 percent cover in shrub communities with >6.5 ft (2 m) depth to groundwater, versus >50 percent cover in grass-dominated communities with <3.2 to 7.5 feet (1 to 2 m) depth to groundwater (Goedhart and Pataki 2011).
The most common groundwater-dependent vegetation type in the Owens Lake area is greasewood (Sarcobatus vermiculatus), making up 22.9 percent of the vegetation in the mapped groundwater-dependent vegetation areas (Stillwater Sciences 2021). Suaeda nigra (bush seepweed) and Atriplex parryi (Parry’s saltbush) are also common in areas where the groundwater is less than 16 ft (5 m) from the surface. Saltgrass (Distichlis spicata) can grow with these shrubs in stable areas, and shrubs transition to saltgrass meadows where there is shallower groundwater. In the upland community (where groundwater is deeper than 16 ft [5 m]), vegetation is dominated by three saltbush species (Atriplex confertifolia, Atriplex parryi, Atriplex hymenelytra) and can also include creosote bush (Larrea tridentata) and sometimes Sarcobatus baileyi and Suaeda nigra (Richards et al. 2022).
While the type and extent of vegetation around much of Owens Lake has likely remained relatively consistent given the stable groundwater conditions, major changes in vegetation have occurred to the north of the lake in Owens Valley. These up-valley areas had been covered by “swampy lowlands” as recently as the early 1900s, (Steward 1933) and they were dominated by large alkali meadows (Benson et al. 2002), requiring canals to drain areas to allow for cultivation (Danskin 1998). By 1920, almost 40 square miles (or 10,000 hectares) of the Owens Valley were cultivated, with 80 percent of those lands abandoned by 1935 due to insufficient water with additional abandonment occurring in the decades that followed (McLendon, Naumburg, and Martin 2012). In the early 1970s, the acreage of phreatophytic plants was similar to that observed between 1912 and 1921 (Griepentrog and Groeneveld 1981). However, once extensive groundwater pumping started in the 1970s, 26,000 acres of the Owens Valley showed a 20–100 percent loss in vegetation cover by 1981 (Griepentrog and Groeneveld 1981). Changes in vegetation associated with changes in depth to groundwater by the combined impacts of precipitation deficits and

SOURCE: Elmore, Mustard, and Manning (2003).
groundwater pumping were documented in the Owens Valley between 1980s and the early 2000s (Figure 2-10). These studies showed both decreased live plant cover and replacement of grasslands by shrubs in Owens Valley (Elmore, Mustard, and Manning 2003; Griepentrog and Groeneveld 1981; Manning, 1997). Groundwater-dependent meadow communities exhibited considerably greater impact due to changes in depth to groundwater than shrub communities (Figure 2-10; Elmore, Mustard, and Manning 2003). In areas adjacent to wellfields, the cover of perennial plants decreased, and grass was replaced by shrubs, while this did not occur in control areas that were not pumped (Jabis 2011; Manning 1999). At present, the dominant vegetation type in the OVPA is characterized as arid or semiarid scrub (LADWP and County of Inyo 1990a).
With the 1990 Long-term Water Agreement, LADWP agreed to manage water resources to avoid environmental impacts, such as decreases in vegetation cover and changes in vegetation type (LADWP and County of Inyo 1990a). The baseline vegetation types and cover guiding these actions were those documented between 1984 and 1987, even though substantial groundwater withdrawal had led to large changes in vegetation type and coverage by this time, and many of these baseline habitats were substantially degraded (Borgias 2024; Danskin 1998). A main tenet of the Long-term Water Agreement is that the extent of five classes of vegetation be maintained or improved to prevent conversion to more water-limited vegetation types. Even with the limits on groundwater pumping, vegetation recovery has been slow, and vegetation has converted to more water-limited types (Borgias 2024; Jabis 2011; Manning 1999). As part of the Long-term Water Agreement, LADWP is required to mitigate some areas of vegetation loss, through efforts such as planting and/or irrigation. Of the 66 required environmental mitigation projects, 9 are complete, 51 are implemented and ongoing, and 6 were implemented but did not meet goals (LADWP 2024a). Some sites have generally achieved the baseline plant cover goals corresponding to the 1984–1987 data, but a number have not, and very few were able to do so during the 2012–2016 drought (LADWP 2024a). In areas with long-term water table drops, grass regrowth after fire is minimal, leading to erosion and conversion to xeric shrubland (Pritchett and Manning 2009). Similarly, on agricultural lands abandoned around high groundwater pumping in 1970, several areas have not had any perennial vegetation recovery, and average recovery rates on drier sites are 60 percent of those of wet sites (McLendon, Naumburg, and Martin 2012).

NOTES: Correlations were statistically significant (p <0.05). Error estimates are shown in the lower right of each graph. Y-axis should read “Change in vegetation cover between 1986 and 1992.”
SOURCE: Elmore, Mustard, and Manning (2003).
ANTHROPOGENIC DISTURBANCE OF VEGETATION AND THE SOIL SURFACE
Anthropogenic disturbances have the potential to increase dust emissions by nearly an order of magnitude either through changes to the soil surface or vegetation (Van Pelt et al. 2020). Any activity that removes vegetation has the potential to increase dust emissions as vegetation decreases the availability of saltating particles (i.e., a supply limitation) and reduces wind shear stress on the surface (i.e., a transport limitation; Sherman and Ellis 2022). Additionally, Gillette et al. (1980) showed that disturbance of the soil surface could dramatically reduce the threshold for aeolian transport through destruction of protective physical crusts (see also Belnap et al. 2007; Khatei et al. 2024; Van Pelt et al. 2020). Baddock et al. (2011) showed that soil surface disturbances could substantially increase dust emissions, partially through reducing the threshold for transport and partially by increasing the number of particles available for emission.
Often a disturbance might impact both vegetation and soils. For instance, off-highway vehicle (OHV) activities can kill vegetation while also breaking up physical and biological crusts and grinding stable aggregates to produce dust-sized particles. OHV traffic is permitted in the Olancha Dunes Recreation area, and vehicles driven onto fine-grained, dry backwater lakes for sport have been reported to create dust emissions (Mel Joseph, Lone Pine Paiute Shoshone Tribe, personal communication, August 2024). Similarly, agriculture removes vegetation, disturbs soil crusts, removes non-erodible clasts, and breaks down soil aggregates, while grazing reduces vegetation cover through herbivory. Animal hooves are also known to break up physical and biological crusts.
CLIMATE CHANGE
Dust control may become more challenging under the changing climate conditions projected for the Eastern Sierra with projections of a 6–10 degrees Fahrenheit increase by 2100 (Dettinger et al. 2018). While annual precipitation in Owens Valley has been relatively consistent since the 1940s with no clear decadal trends (Figure 2-11), predictions for future trends in precipitation across the Sierra Nevada range from −5 percent to

NOTES: Red line is the mean of the annual values.
SOURCE: Data from AgACIS at Bishop Airport.
+10 percent by 2070–2099 (Dettinger et al. 2018). Modeling by the Owens Valley Groundwater Authority (2021) predicted a 6 percent increase in precipitation along with a 19 percent increase in evapotranspiration, resulting in an average 3 percent increase in groundwater recharge by 2045. More precipitation is expected in the form of rain rather than snow, leading to earlier stream flow (Harpold et al. 2015) into the Owens Valley.
Although the average annual precipitation may not change considerably, precipitation extremes are projected to increase (Swain et al. 2018) with more precipitation falling in large events (e.g., atmospheric rivers; California DWR Climate Change Technical Advisory Group 2015; Espinoza et al. 2018; Gershunov et al. 2019; Huang, Stevenson, and Hall 2020). With a 5–30 percent increase in large storms (Dettinger et al. 2018) and a 40 percent average increase in peak hourly precipitation rates (Huang, Stevenson, and Hall 2020), frequent flood events that cause sediment movement that may then remobilize as dust are more likely (East and Sankey 2020). With climate change, the length of time between rain events is expected to increase (Polade et al. 2017), which together with increased evapotranspiration contributes to a projected 50 percent decrease in streamflow during drought years (Alex Hall, UCLA, personal communication, July 2024). Vegetation cover may decrease during extended dry periods (especially under hotter temperatures), making the surfaces more vulnerable to erosion and dust emission.
TRIBAL KNOWLEDGE AND CULTURAL PRIORITIES
The Nüümü (Owens Valley Paiute) named the Owens Valley “Payahuunadü” or “land of flowing water” (Owens Valley Indian Water Commission 2024). A date of 1000 CE is often given for the arrival of the Paiute
into the Owens Valley (Varner 2009). However, human occupation has occurred over a much longer period in the southwest United States, as far back as 23,000 years ago (Pigati et al. 2024). Owens Valley was one of the most densely settled regions of the entire Great Basin and was unique in the Great Basin due to its permanent villages (Lawton et al. 1976). These settlements were supported by a mix of hunting, gathering, and agriculture, partially supported by extensive water flow from the Sierra Nevada, resulting in the prevalence of the “swampy lowlands of Owens Valley where it is obvious that moist soil—a natural irrigation—produces a very prolific plant growth” (Steward 1933). Importantly, cultivation of important food plants (Cyperus esculentus), fish, and productive meadows were also supported through water redistribution by the Nüümü through extensive canals, berms, weirs, and dams to control water flow seasonally and yearly (Cheyenne Stone, Big Pine Paiute Tribe of the Owens Valley, personal communication, November 2024; Haverstock, Jayko, and Williams 2022; Lawton et al. 1976; Madley 2016). These agricultural canals were established between 639 and 512 years before the present day (Haverstock, Jayko, and Williams 2022), and they were documented across a distance of 57 miles along the Owens Valley, from Independence Creek (near the center of the OVPA) to Rock Creek (well north of the OVPA; Lawton et al. 1976). However, it is likely that agriculture through irrigation was not practiced near Owens Lake because food supply there depended on abundant fish and fly larvae supported by the lake (Lawton et al. 1976).
The Anglo incursion into Paiute territory was both unexpected and deadly (Varner 2009). In 1863, more than 900 Owens Valley Paiutes were forced to relocate to San Sebastian Reservation near Fort Tejon, and others fled into the mountains. When many returned in 1866, settlers had repurposed their fields for grazing and their irrigation ditches to grow introduced crops (Haverstock, Jayko, and Williams 2022; Lawton et al. 1976). By 1900, Inyo County’s economy relied on agriculture, with some farms being owned by Native Americans, and many farms relying on the work of Native Americans (Borgias 2020). When the city of Los Angeles bought farmland in Owens Valley in the 1900s, many people, including the Paiute, lost ownership of, or access to, their water rights (Borgias 2024).3 A top priority of some tribes is to restore the valley’s hydrology by ending water diversions, export, and groundwater pumping because this water is the key resource that supports the diverse ecosystem types that have been degraded since water diversion (Cheyenne Stone, Big Pine Paiute Tribe of the Owens Valley, personal communication, November 2024; Sean Scruggs, Fort Independence Indian Reservation, personal communication, September 2024).
Of the approximately 19,000 residents of Inyo County, 13.8 percent identify as Native American, compared with 1.7 percent statewide (Cowan 2024). The Owens River is commonly used by Tribal members for hunting and fishing and gathering of native vegetation for various purposes, and the river area is used as a respite from extreme heat (Mel Joseph, Lone Pine Paiute-Shoshone Reservation, personal communication, August 2024). Tribal concerns have also been expressed for the conservation and protection of culturally important sites. The Patsiata Historical District was recently nominated for listing in the California Register of Historical Resources and in the National Register of Historic Places. The publicly available executive summary of the nomination notes that the District is associated with the traditions and history of the Indigenous People of Payahuunadü and that the archaeological sites provide important information about Nüümü and Newe history and culture.
SUMMARY
The geology and hydrology of Owens Valley conspire to create areas of sediment with the potential to be moved by wind and water. Vegetation cover plays an important role in minimizing dust emissions, and this vegetation is highly dependent on water availability. Diversion of surface water and decreases in groundwater have been linked to loss of meadows and decreases in shrub cover in the northern section of the OVPA. However, the area near Owens Lake has shown stable groundwater levels that have not been impacted by the diversion of Owens River nor groundwater pumping up-valley. Nevertheless, climate changes like extreme droughts could result in increased dust due to loss of vegetation and changes in groundwater if the area is not carefully managed. Additionally, climate change may impact the OVPA’s vulnerability to dust emissions with more extreme and frequent precipitation events that will deposit more fine-grained materials and result in greater PM10 emissions.
___________________
3 This sentence was edited after release of the report to clarify information from Borgias, 2024.


