Pathways to Doctoral Degrees in Computing (2025)
Chapter: 2 Understanding Supply and Demand for Computing Doctorates
2
Understanding Supply and Demand for Computing Doctorates
Like other forms of economic demand, demand for doctorates in computing can be estimated only indirectly. This chapter characterizes past and current demand for computing PhDs, and how that demand may evolve in the future. It relies on three sources of information: (1) quantitative data on historical trends in the production, composition, and hiring outcomes of computing PhDs nationwide; (2) briefings to the committee from computing experts situated in the key sectors of academia, industry, and government on current hiring shortfalls for computing PhDs; and (3) supporting information detailing current demand pressures and examples of organizational responses.
While quantitative data reliably report production of doctorates in computing fields, it is not possible to measure the magnitude of any gap between the supply and demand nor forecast future demand due to the absence of data. Rather, to best understand the need for doctoral degrees in computing, the committee used available data to document changes in supply over time, observe general employment trends, and, together with advice from experts, examine indicators of computing labor market imbalances. The latter includes an insufficient supply of computing doctorates to fill available positions, as well as unmet demand due to labor market frictions, such as pay disparities or difference in missions or goals between sectors.
INFORMATION SOURCES AND METHODOLOGICAL APPROACH
Over the past decade, the annual number of computing doctorates produced by U.S. doctoral-granting institutions has increased nearly 50 percent. Whether this supply is
sufficient to meet demand for teaching and research positions across different sectors is difficult to assess. Together, data and testimony suggest that while the supply of doctorates is largely keeping pace with demand for research faculty at leading universities and in industrial research and development, the demand for both tenure-track and non-tenure-track faculty at teaching-intensive universities and national security industrial and governmental positions is not being met. This nuanced picture suggests the need for targeted recommendations to satisfy the unmet demand for teaching-intensive positions while also sustaining the continued growth in the number of doctorates to fill research-intensive positions in academia and industry.
The information sources the committee relied on provide complementary insights into the supply and demand for computing PhDs. The majority of data available for this report are on the supply of computing doctorates and employment outcomes over the past decade, as well as trends on the composition of computing department faculty. Data on demand are more difficult to obtain and are limited to indirect evidence such as faculty hiring success rates and changes in faculty and industry salaries, as well as government forecasts.
The best data sources are large-scale and comprehensive. For this report, three key sources of data are used to construct quantitative arguments:
- The Integrated Postsecondary Education Data System (IPEDS) Completions Survey, conducted by the National Center for Education Statistics, collects information on the number and types of degrees awarded by U.S. postsecondary institutions and the characteristics of degree recipients. All institutions that participate in federal student financial aid programs are required to complete IPEDS surveys.
- The Survey of Earned Doctorates (SED), conducted annually by the National Science Foundation (NSF), is a voluntary census of all recipients of research doctorates from U.S. institutions. The SED collects information on the doctoral recipient’s educational history and post-graduation plans. Since its introduction in 1957, the SED has consistently attained response rates exceeding 90 percent from doctoral recipients.
- The Computing Research Association (CRA) Taulbee Survey, administered by CRA, asks North American doctoral-granting departments of computer science, computer engineering, and information science about their students and faculty. The Taulbee Survey is the principal source of information on the enrollment, production, and employment of PhDs and in providing salary and demographic data for faculty in computing. On average, the Taulbee Survey has had a response rate of 73 percent for U.S. institutions with
- PhD programs in computing over the last 25 years. By design, the Taulbee Survey does not cover non-doctoral-granting institutions and therefore does not provide any information for computing departments at teaching-focused institutions.
Although these data provide a “big picture” of aggregate trends across institutions and computing fields broadly defined, they often lack detailed information on specific subgroups or specialized cases. These data also do not provide direct evidence of current or future demand, although they do provide evidence to assess potential labor market imbalances such as employment outcomes and average salaries. Some sources of quantitative data may be incomplete, due to their manner of collection—for example, voluntary contribution by academic departments, providing some insight into many or even most institutions, but not all, such as the annual Taulbee Survey or special reports like Craig Wills’s survey on failure rates in computing faculty hiring (Wills 2022, 2023).
However, none of these data sources provide insights into the reasons for those variations or trends as there are no quantitative data that directly measure demand shortfalls. Quantitative data can also be detailed for some aspects of a system and unavailable for other critical aspects—for example, because data exist but reside within individual institutions and are not available in aggregate. Moreover, quantitative data may be available only on a lag of 1 or more years, providing insights into patterns for some years in the past but not about current or very recent trends.
This report relies on responses from academic departments in faculty hiring success rates, anticipated faculty hiring, and government forecasts of the future demand for computing researchers broadly. Large-sample evidence is complemented with testimony by computing experts in different societal sectors, which provide insights into perceived demand shortfalls and the induced pressures organizations face as a result, which are not present in quantitative data. At the same time, these reports lack the broad purview of good quantitative data and may be subject to cognitive and behavioral biases, but collectively construct a consistent view that aligns with quantitative data and other facts.
To adequately assess the relationship between supply and demand for doctoral degrees in computing, the committee considered the following two key viewpoints: (1) data indicating current demand and projections of future demand and (2) individual perspectives on demand as exemplified by presentations to the committee. The result provides an overall picture that the supply of computing PhDs has grown steadily over the past decade. However, the committee both heard and itself voiced different interpretations on the extent to which this supply is meeting current demand, and potential future demand, for computing PhDs in industry, government, and academia. While
there are broad concerns that shortfalls may increase in the future, these concerns need to be balanced with the prospect of growing PhD programs too quickly and creating an oversupply of computing doctorates (Stephan 2012). Labor supply in burgeoning areas, such as artificial intelligence (AI), will always lag behind changes in labor demand. Over-responding to demand signals could result in overproduction, longer duration postdoctoral positions, and depressed salaries. Nevertheless, balancing changes in the labor market with national needs for computing PhDs is important for continued growth in PhD production and will require continued intervention that has facilitated growth over the past decade.
SIZE, GROWTH, AND COMPOSITION OF COMPUTING DOCTORATES
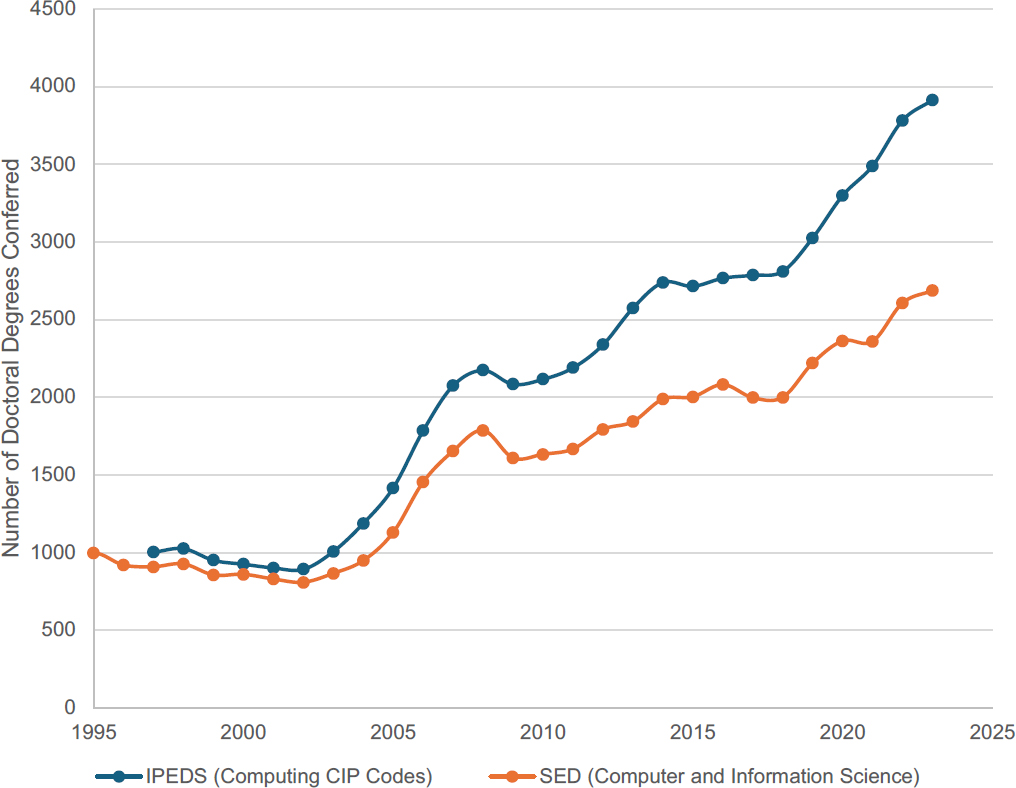
Developing a detailed view of the size and growth of the production of computing PhDs from U.S. research universities requires analysis of several different data sources. Within the United States, there are more than 275 departments granting doctorate degrees in computer science, information science, or computer engineering (Zweben and Bizot 2024). To understand the composition of computing doctorates, data on “computer and information science” degrees awarded from the NSF Survey of Earned Doctorates was analyzed alongside data from the IPEDS Completions Survey from CIP (Classification of Instructional Programs) codes used to classify computing degrees across disciplines, using the canonical definition of Zweben and Bizot (2016) (Figure 2-1).
Production of doctoral degrees in computing remained relatively flat year to year from 1997 to 2003 at around 1,000 doctorates annually across computing disciplines, with a large portion of these in computer and information sciences. Starting in 2004, production increased rapidly to almost 2,200 doctorates in computing per year by 2008. This surge likely reflects expanded graduate program capacity following increased funding in cybersecurity and information technology research and creation of fellowship programs such as CyberCorps, reduced industry demand in the wake of the early 2000s tech bust driving students into graduate school, and increased international student enrollment, especially from China and India.
Over the past decade, the number of doctoral recipients per year in computing has further increased 52 percent, rising from around 2,500 in 2013 to more than 3,900 in 2023, with much of the growth occurring since 2018. During the same period, the number of doctorates in computer and information science specifically has increased at a slower rate of 45 percent. The growing deviation between computer and information science and computing more broadly is indicative of increased study of computer engineering, computational science, and other interdisciplinary computing fields.
NOTE: The database query parameters for IPEDS data retrieved from the NCSES Chart Builder are available in a note at the end of Chapter 2.
SOURCES: Data from National Center for Science and Engineering Statistics, 2024, Doctorate Recipients from U.S. Universities: 2023 Data Tables, NSF 24-336, National Science Foundation, https://ncses.nsf.gov/surveys/earned-doctorates/2023; Department of Education, National Center for Education Statistics, Integrated Postsecondary Education Data System, Completions Survey, unrevised provisional release data, accessed June 2, 2025.
Notably, the production of computing PhDs is unevenly distributed across PhD-granting institutions, and production tends to be concentrated among more prestigious institutions. One recent study estimated that, in 2017, the top 20 percent of computing PhD programs by prestige accounted for 50.8 percent of all grant-funded computing graduate students (Zhang et al. 2022).
For computer and information sciences, the median time to completion of a doctorate from the start of graduate school was 7 years in 2023, down from 7.8 years in 2018 (NCSES 2024, Table 1-12). During this time, the median years to obtain a research doctorate after earning a bachelor’s degree is approximately 1 year longer (8.2 years in 2018 and 8.6 years in 2023), a gap that has grown wider over the past decade. The
additional time between completion of bachelor’s and doctoral degrees could be indicative of students returning to a PhD program after having been in the workforce.
As a result of the median time to completion, any new expansion of support for computing PhD production would take a similar amount of time to be reflected in the number of graduating computing PhDs. For example, a substantial increase in the number of new computing PhD students admitted nationwide in 2024 would produce an increase in the number of new computing PhD recipients around 2029–2030. Hence, the relatively steady increase in production over the past 10 years reflects a steady increase in the number of computing PhD students “on the pathway” over this time—for example, due in part to sustained past investments by NSF’s CISE directorate in expanding support for doctoral training in computing. Thus one would expect that PhD production will hold steady over the next 5 years owing to past levels of support, although it remains to be seen what long-term effects the COVID-19 pandemic may have had (Box 2-1).
Relationship Between Undergraduate Degree Production and Doctoral Enrollments in Computing
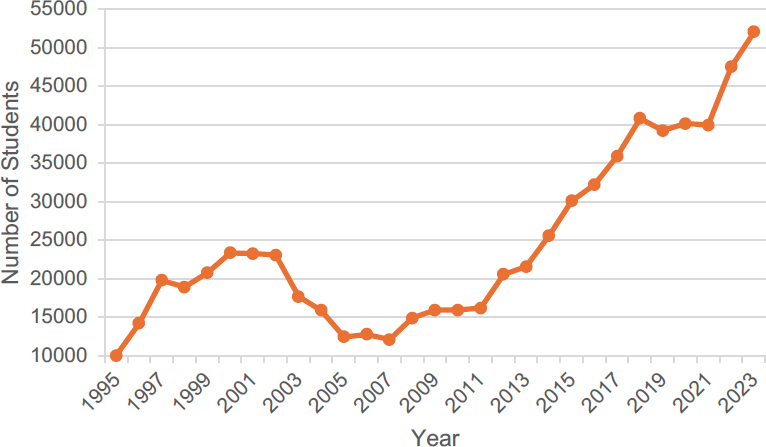
The steady increase in doctoral degrees in computing contrasts with the more cyclical production of computing undergraduate degrees, which has historically exhibited
BOX 2-1 COVID-19 and Doctoral Production
The COVID-19 pandemic negatively affected the attainment of research doctoral degrees, but new data from the Survey of Earned Doctorates (SED) show doctoral awards have rebounded. Data from academic year 2022 (1 July 2021 through 30 June 2022) report the highest number of research doctoral conferrals ever in a single academic year: 57,596. Delays in graduation and other disruptions to the completion of doctoral requirements contributed to this increase, with more than half of the 2022 doctorate recipients […] reporting the pandemic had delayed the timeline for completing their doctoral degree. The new SED data also show that between 2021 and 2022 the proportion of doctorate recipients with commitments for employment in the academic sector declined by 3.7 percentage points, while the proportion taking positions in the private sector increased by 4.4 percentage points. However, a few additional years of data will be needed to understand the full impact of the pandemic on research doctoral degrees from U.S. institutions and their recipients.a
The impact of the COVID-19 pandemic on supply of and demand for computing doctorates was uneven and is still being understood. In 2020–2021, many but not all universities implemented hiring freezes when there was uncertainty in endowments and future funding. In contrast, many technology companies dramatically expanded their workforces during this time, and some computing doctorates who otherwise would have taken faculty jobs may have opted for industry instead. As a result, it is difficult to draw strong conclusions from employment data for computing doctorates from 2021–2023.
__________________
a R. Heuer, P. Einaudi, and K. Kang; National Center for Science and Engineering Statistics (NCSES), 2023, “Research Doctorate Conferrals Rebound, Leading to Record Number of U.S. Doctorate Recipients in 2022,” National Science Foundation, https://ncses.nsf.gov/pubs/nsf23353.
multiple boom-and-bust cycles: one in the 1980s (NASEM 2018a, Figure 2-1), one in the late 1990s and early 2000s, and one unfolding today (Figure 2-2). For instance, from 2013–2023, the number of undergraduate majors in computing at doctoral-granting institutions has more than doubled, from an estimated 22,000 to 52,000 students.
These very different patterns in computing degree production suggest that either (1) student interest in computing PhDs has not been as sensitive to the macroeconomic and social factors that drive student interest in computing undergraduate degrees—that is, PhD student interest is neither cyclic nor “counter-cyclic” with industry, or (2) production capacity for computing PhDs—for example, faculty mentoring time and external funding (see Chapter 4)—is relatively inelastic relative to changes in student interest (in contrast to capacity for undergraduate computing degrees). Because the number of computing PhDs averages less than approximately 10 percent of the number of computing undergraduate degrees, should PhD production remain the same as undergraduate production increases, the share of those students who go on to pursue a PhD in computing necessarily decreases.
Although there are concerns that the declining share of computing undergraduates enrolling in doctoral programs may pose a problem for meeting societal demand for computing PhDs, the committee did not find evidence to support this concern. The dramatic increases in undergraduate enrollments are widely understood to be driven in large part by students pursuing high-paying jobs in industry that require only an undergraduate degree. As a result, the declining share of undergraduates entering doctoral
SOURCE: Modified from S. Zweben and B. Bizot, 2024, “Taulbee Survey: All Degree Levels Exhibit Record Number of Graduates and Strong Enrollment,” Computing Research Association, https://cra.org/wp-content/uploads/2024/05/2023-CRA-Taulbee-Survey-Report.pdf.
programs is not in and of itself a cause for concern. Computing PhD programs are not facing a decline in qualified applicants, and, if anything, they would admit more applicants if there was sufficient funding and faculty to train them. That is, the very large number of domestic undergraduate majors in computing and related fields, in conjunction with a large number of qualified international students, appear more than sufficient to saturate PhD programs’ current capacity to train new computing PhDs. At the same time, not all computing PhD programs experience this saturation effect, as students often prefer more prestigious programs—applying only to the “top N” programs—and as a result, many students do not consider less prestigious programs where they would nevertheless receive an adequate educational experience, potentially implying unused production capacity outside the “top N” doctoral programs.
Mix of Domestic and International Students Receiving Computing Doctorates
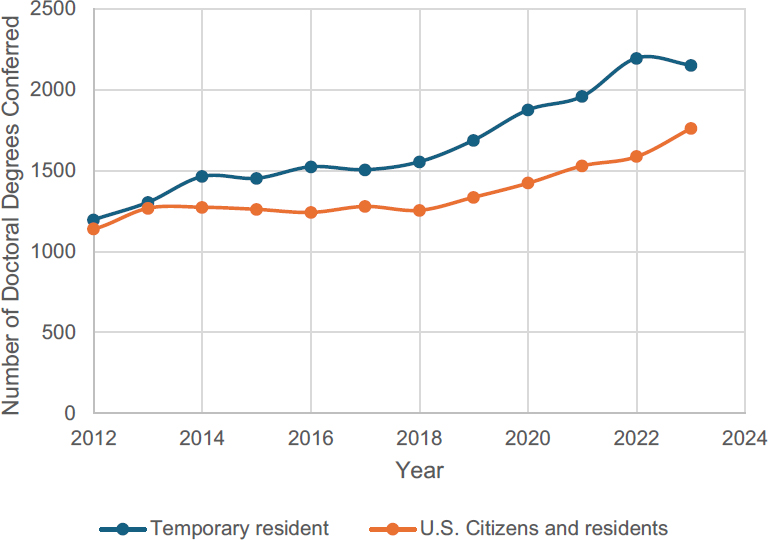
Many doctoral recipients in computing, as is the case in other science, technology, engineering, and medicine fields, held temporary visas to pursue their degree. The share of computing doctorates who are temporary visa holders (henceforth called “international students,” in contrast with those who are U.S. citizens and permanent residents, henceforth called “domestic students”) has increased from 51 percent in 2012 to 58 percent in 2022. That is, a growing majority of computing PhDs are international students (Figure 2-3). Notably, more than half of all international students come from China and India, with each share making up 37 and 17 percent, respectively (Figure 2-4). These broad trends are often attributed to a growing value placed on U.S. higher education. Additionally, these trends can be attributed to domestic undergraduates lacking the preparation or desire to pursue doctoral programs in computing.
The large number of international students applying to computing PhD programs suggests that increased demand for computing PhDs in the United States could potentially be met by simply admitting and training more international students to U.S. PhD-granting programs. However, two factors indicate that this strategy would not succeed in meeting the growing demand for computing PhDs.
- Foreign doctorates face challenges in obtaining work visas for industry employment, where demand for computing doctorates is greatest, and in government because they are ineligible for jobs that require U.S. citizenship.
- International students generally have greater work restrictions due to work visa quotas, limits on H-1B and permanent resident visas, and are sensitive both to unpredictable U.S. immigration policy dynamics and to shifting competition from other countries.
NOTE: The database query parameters for IPEDS data retrieved from the NCSES Chart Builder are available in a note at the end of Chapter 2.
SOURCE: Data from Department of Education, National Center for Education Statistics, Integrated Postsecondary Education Data System, Completions Survey, unrevised provisional release data, accessed June 6, 2025.

SOURCE: Data from National Science Board, National Science Foundation, 2023, Science and Engineering Indicators 2024: Higher Education in Science and Engineering, NSB-2023-32, https://ncses.nsf.gov/pubs/nsb202332.
The complexities of work visas may be less restrictive on large, well-resourced or multi-location companies, but can be prohibitive for start-ups and other smaller or more localized firms in industry, especially in the wake of recent visa fee increases. Hence, even as international students are an increasing majority of computing PhD recipients, the asymmetry between the employment opportunities for international and domestic students indicates the importance of increasing the production of domestic PhDs.
EARLY CAREER OUTCOMES
Concurrent with the overall increase in the total number of computing doctorates produced each year, the relative shares of new computing doctorates taking jobs in academia, industry, and government has changed over the past decade. In particular, the number and share of new computing doctorates taking jobs in industry have increased and are now similar to historic levels for engineering fields.
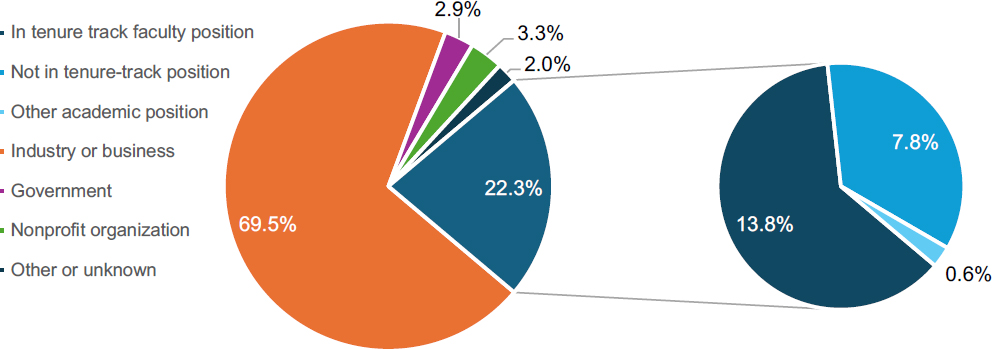
Of the 2,037 doctorate recipients in computer and information sciences reporting post-graduation status in 2023, 16.0 percent had definite postdoctoral training plans, 95.4 percent of which were a postdoctoral fellowship or research associateship, and 62.0 percent had definite employment plans (NCSES 2024, Table 9-5). The majority of doctorate recipients with definite employment plans, 69.5 percent, were pursuing positions in industry, compared to only 22.3 percent pursuing academic positions (an increase from 20.9 percent in 2022). Within the doctorate recipients with academic employment plans, 62.1 percent of doctorate recipients were in tenure-track faculty positions, and 35.1 percent were in teaching-track and other positions (Figure 2-5).
Over the past decade, the number of computing doctorates with definite industry employment plans after graduation increased from 536 in 2013 to 974 in 2023, with the overall share with employment plans in industry increasing from 68.8 percent to 71.3 percent (NCSES 2024, Table 2-6). This share is similar to other science, technology, engineering, and mathematics (STEM) fields like engineering and physical sciences, which have historically averaged roughly 75 percent of doctorates working in industry during this time (NCSES 2024, Figure 14).
Over the same period, an increase in computing doctorates with tenure- or non-tenure-track academic positions was seen (184 in 2013 and 299 in 2023), representing a share of 23.6 percent and 21.6 percent, respectively (NCSES 2024, Table 2-6). Thus, while a greater share of computing doctorates are entering industry, given the growth in the overall number of computing doctorates, the number remaining in academia continues to increase.
SOURCE: Data from National Center for Science and Engineering Statistics, 2024, Doctorate Recipients from U.S. Universities: 2023 Data Tables, NSF 24-336, National Science Foundation, https://ncses.nsf.gov/surveys/earned-doctorates/2023.
Among computing PhDs with definite employment plans after graduation in 2023, 2.9 percent had plans for employment in government positions, including positions at national laboratories, and 3.3 percent had plans for employment at nonprofit organizations, such as research institutes (NCSES 2024, Table 9-5).
Employment Trends by Computing Specialty
Students who successfully complete their doctorate in computing have a wide range of occupations open to them, particularly those who study in high-demand subfields. There is an increasing tendency of PhD holders in computing to move into highly paid industry positions versus academic roles that pay less. Therefore, graduation and early-career employment trends vary across various computing specialties and sectors (Figure 2-6).
AI and machine learning (ML) stands out as the most dominant field, with the highest number of graduates employed across all sectors—especially in industry, followed closely by academia, and with smaller but noticeable representations in government, self-employment, and other sectors. This broad distribution underscores the wide applicability and high demand for AI/ML expertise. Another highly represented specialty is human–computer interaction (HCI), which has a particularly strong presence in academia and a number in industry, indicating its interdisciplinary value in both research and applied technology roles.
Fields such as software engineering, security and information assurance, high-performance computing, robotics and computer vision, and computer architecture and hardware all show strong employment in industry, reflecting their practical, application-driven nature. In contrast, specialties like computing education, theory and algorithms,
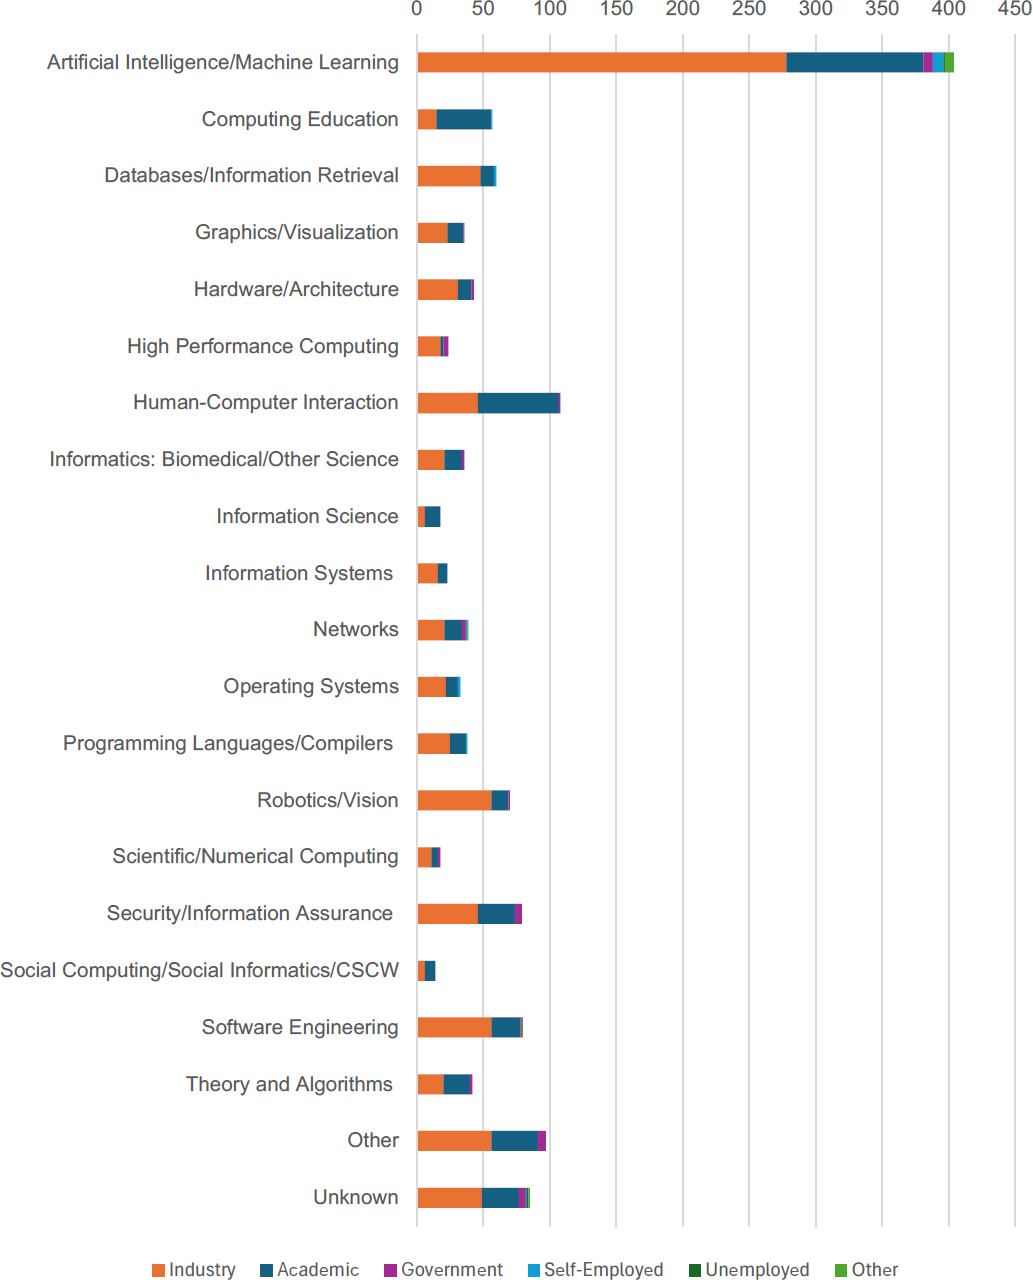
SOURCE: Data from S. Zweben and B. Bizot, 2024, “Taulbee Survey: All Degree Levels Exhibit Record Number of Graduates and Strong Enrollment,” Computing Research Association, https://cra.org/wp-content/uploads/2024/05/2023-CRA-Taulbee-Survey-Report.pdf.
scientific computing, and information science are primarily academic in nature and attract graduates who pursue careers in teaching and theoretical research.
Some specialties strike a more balanced distribution. For example, databases and information retrieval is well represented in both academia and industry. Interdisciplinary specialties, such as informatics and social computing have smaller graduate numbers overall, but are distributed among academia, industry, and government.
Overall, the majority of computing graduates are absorbed by industry, especially in applied fields, while academia remains the dominant employer for more theoretical or educational specialties. Employment in government and self-employment is present but much smaller in scale.
Starting Salaries for Computing Doctorates
As with all academic fields, faculty positions pay lower salaries than positions in industry. According to 2023 data on computing research positions, the median salary in industry was $170,000, compared to $110,000 in academia (9-month salary) and $130,000 in government (NCSES 2024, Table 6-7).
When including bonuses, total compensation in industry employment can be even higher. For instance, data from a leading public university computer science department show that the average starting salary for doctorates graduating in 2022 was $167,231 with an average signing bonus of $49,914, or total compensation of $217,145. At this same department, the average 9-month salary for assistant professors, many of whom recently graduated themselves from other top-10 departments, was $142,443. In addition, job search websites like Glassdoor.com indicate that industry salaries for computing doctorates often range from $200,000 to $300,000, especially in subfields like AI or in locations near technology hubs. On the other hand, reports of industry salaries of $500,000 or more appear to be outlier cases of doctorates with extremely specialized expertise that is in high demand and not representative of the average salaries for most computing doctorates.
Experts in government reported that salary differences with industry often made filling open positions for computing doctorates more difficult. Experts in academia reported similar difficulties, but these reports varied substantially across institutions—for example, worse for lower-prestige or non-PhD-granting institutions, and by subfield—for example, worse in subfields like AI with high industry salaries (Agarwal and Ohyama 2013).
Notably, connecting salaries and demand is complex. Individuals have diverse motivations for seeking a doctorate in computing, and these motivations may change over time in response to economic opportunities or experience. Industry salaries have historically been higher than academic faculty salaries, and this difference holds across
BOX 2-2 Demand and Salaries for Computing PhDs
In a traditional labor economics framework, greater demand relative to the supply of skilled labor will translate into rising salaries for individuals with those skills. In the short term, demand for such skills often leads to supply, but as workers respond by gaining the skills in demand, supply will increase and salaries will come down. For computing PhDs, this expectation is often borne out in industry, where rising demand for computing PhDs with expertise in “hot” areas like artificial intelligence or security can expect greater total compensation than computing PhDs in other areas, all other things being equal.
However, the relationship between salary and demand is more complex in government, where salaries are more constrained, and in academia, where noncommercial motives such as priority of discovery, recognition of merit awards, and reputation are valued,a in addition to institutional constraints, particularly for public universities. Although academic salaries for computing PhDs tend to be lower than industry salaries, faculty have historically reported choosing these jobs for other benefits, such as greater autonomy in research projects, opportunities to work with graduate students, and the flexibility offered in academia. For the highest-performing faculty in areas of high demand in industry, however, the trade-off may be more marginal. The gap between academic and industry salaries has varied over the past 30 years, with greater volatility in industry in response to booms and busts while academic salaries are more stable and secure from year to year.
__________________
a R.K. Merton. 1979. The Sociology of Science. The University of Chicago Press.
STEM fields (Box 2-2). Studies suggest that many doctoral students who express a preference for an academic career prefer specific job amenities such as greater autonomy and opportunities to work on more fundamental research, while students who express a preference for industry careers more strongly prefer financial compensation and care less about autonomy (Roach and Sauermann 2010). But the effect on career preferences of increasing industry salaries relative to government or academic salaries for computing PhDs remains unclear and deserves careful monitoring.
DATABASE QUERY PARAMETERS FOR THE NATIONAL CENTER FOR SCIENCE AND ENGINEERING STATISTICS CHART BUILDER
Figures 2-1 and 2-3 in this report were generated using publicly available data from the National Center for Education Statistics (NCES) IPEDS to examine historical degree completions trends. These data were accessed via the online National Center for Science and Engineering Statistics Chart Builder System,1 managed by NSF. This section describes details of what data were used in each of these plots—including Data Source, Measures, Dimensions, and Classifications Variables—for the interested reader who might want to reproduce these data sets.
___________________
1 See the Chart Builder System website at https://ncsesdata.nsf.gov/builder/ipeds_c.
IPEDS Completions Survey: Awards/Degrees Conferred
Year: All Values
Award Level: Doctor’s Degree (including Doctor’s degree-research/scholarship; Doctor’s degree-professional practice; Doctor’s degree-other; Doctor’s degree [old degree classification])
Citizenship: All Values
Academic Discipline, 6-Digit CIP:
09.0702 - Digital Communication and Media/Multimedia.
10.0304 - Animation, Interactive Technology, Video Graphics, and Special Effects.
11.0101 - Computer and Information Sciences, General.
11.0102 - Artificial Intelligence.
11.0103 - Information Technology.
11.0104 - Informatics.
11.0105 - Human-Centered Technology Design.
11.0199 - Computer and Information Sciences, Other.
11.0201 - Computer Programming/Programmer, General.
11.0202 - Computer Programming, Special Applications.
11.0203 - Computer Programming, Vendor/Product Certification.
11.0204 - Computer Game Programming.
11.0205 - Computer Programming, Specific Platforms.
11.0299 - Computer Programming, Other.
11.0301 - Data Processing and Data Processing Technology/Technician.
11.0401 - Information Science/Studies.
11.0501 - Computer Systems Analysis/Analyst.
11.0701 - Computer Science.
11.0801 - Web Page, Digital/Multimedia and Information Resources Design.
11.0802 - Data Modeling/Warehousing and Database Administration.
11.0803 - Computer Graphics.
11.0804 - Modeling, Virtual Environments and Simulation.
11.0899 - Computer Software and Media Applications, Other.
11.0901 - Computer Systems Networking and Telecommunications.
11.0902 - Cloud Computing.
11.0999 - Computer Systems Networking and Telecommunications, Other.
11.1001 - Network and System Administration/Administrator.
11.1002 - System, Networking, and LAN/WAN Management/Manager.
11.1003 - Computer and Information Systems Security/Auditing/Information Assurance.
11.1004 - Web/Multimedia Management and Webmaster.
11.1005 - Information Technology Project Management.
11.1006 - Computer Support Specialist.
11.1099 - Computer/Information Technology Services Administration and Management, Other.
11.9999 - Computer and Information Sciences and Support Services, Other.
14.0901 - Computer Engineering, General.
14.0902 - Computer Hardware Engineering.
14.0903 - Computer Software Engineering.
14.0999 - Computer Engineering, Other.
26.1103 - Bioinformatics.
26.1104 - Computational Biology.
26.1199 - Biomathematics, Bioinformatics, and Computational Biology, Other.
27.0303 - Computational Mathematics.
27.0304 - Computational and Applied Mathematics.
30.0801 - Mathematics and Computer Science.
30.1601 - Accounting and Computer Science.
30.3001 - Computational Science.
30.3101 - Human Computer Interaction.
30.4801 - Linguistics and Computer Science.
30.7001 - Data Science, General.
30.7099 - Data Science, Other.
30.7101 - Data Analytics, General.
30.7102 - Business Analytics.
30.7199 - Data Analytics, Other.
50.0102 - Digital Arts.
51.2706 - Medical Informatics.
52.1201 - Management Information Systems, General.


