Veterans, Prescription Opioids and Benzodiazepines, and Mortality, 2007–2019: Three Target Trial Emulations (2025)
Chapter: 5 The Effect of Opioid Escalation on All-Cause Mortality, Including Suicide Mortality
5
The Effect of Opioid Escalation on All-Cause Mortality, Including Suicide Mortality
INTRODUCTION
Within a group of those newly dispensed opioid pharmacotherapy, specific prescribing practices and patterns may result in varying levels of risk for death (Coyle et al., 2018). Of particular concern to individuals, clinicians, and policy makers is whether opioid dosage changes have an impact on the potential for harm. In this chapter, the committee focuses on the effect of opioid dosage escalation on all-cause mortality and suicide mortality. Appendix E describes the committee’s assessment of studies examining the effect of dosage reductions on mortality.
Two primary causes of death, overdose and suicide, have been discussed as the predominant means by which opioid dosages may influence mortality, although other mechanisms are possible (Bohnert and Ilgen, 2019; Oquendo and Volkov, 2018; Racine, 2018; Dunn et al., 2010). The daily dosage and duration (i.e., cumulative dosages) of prescribed opioid pharmacotherapy along with concurrent prescriptions of sedating pharmacotherapy (e.g., benzodiazepines, gabapentinoids) may influence respiratory depression, contributing to fatal and nonfatal overdoses (Hahn et al., 2022; Dasgupta et al., 2016; Ilgen et al., 2016; Park et al., 2015; Bohnert et al., 2011b). Prescribing an individual a large dosage of opioid pharmacotherapy may also provide lethal means for suicide among those at risk (Magarbeh et al., 2023; Gomes et al., 2011; Sarchiapone et al., 2011), and chronic pain is a risk factor for suicide mortality (Racine, 2018; Ilgen et al., 2010). Additional possible mechanisms of death associated with higher opioid dosages include infections (Chung et al., 2021), falls (Santosa et al., 2020), motor vehicle crashes (Chihuri and Li, 2019; Li and Chihuri, 2019), wound and violence-related injuries (Hayes et al., 2020), incident cardiovascular disease (Sung et al., 2024), and psychological factors, such as new-onset depression (Salas et al., 2017).
Opioid tolerance is the pattern of deriving less analgesic effect after sustained and continuous use of opioid pharmacotherapy (Cahill et al., 2016). Given that tolerance is a common result of consistent use of opioid pharmacotherapy, opioid dosages may increase over time to achieve the same degree of analgesia, and may differ between individuals (Mercadante et al., 2019). Tolerance can be observed in as little as a few days or weeks of repeated use (Morgan and Christie, 2011). This tolerance does not apply to effects such as respiratory suppression, which is dose dependent (Hayhurst and Durieux, 2016). As a result, guidance for prescribing opioids is to “start low and go slow” until pain control is achieved (Forbes, 2011). Additionally, the U.S. Department of Veteran Affairs (VA)/ Department of Defense (DoD) and Centers for Disease Control and Prevention (CDC) Clinical Practice Guidelines for Prescribing Opioids and other sources caution against increasing doses to higher levels (Sandbrink et al., 2023, 2020; VA/DoD, 2022, 2017; Dowell et al., 2022, 2020, 2016). However, the threshold of what constitutes a “low”
versus “high” opioid dose is inconsistent in the literature and initial opioid doses vary. Additionally, there may be variation in how different individuals respond to the same opioid dose.
Prior studies indicate that higher opioid doses over longer durations are generally associated with greater overdose risk, although contextual factors, such as whether the individual was opioid naïve, are also important (Binswanger et al., 2022; Weiner et al., 2022; Bohnert et al., 2011a). The pacing of dosage changes also appears to have an influence on the risk of overdose (FDA, 2022). Thus, both the initial opioid dosage and pace of dosage increases are aspects of opioid prescribing for which different clinicians have reasonably varied in their practices.
A number of studies have found an association of higher versus lower dosages with risk of overdose, suicide, and all-cause mortality. However, these studies have not had “new user” designs that strengthen the potential for causal inference. Among individuals receiving care at the Veterans Health Administration (VHA) system specifically, higher compared to lower opioid dosages have been found to be associated with an increased risk of overdose in a dose–response fashion (Bohnert et al., 2011a). For example, relative to a dosage of 1 to < 20 morphine milligram equivalents (MMEs) per day, 20 to <50, 50 to <100, or ≥100 MMEs was associated with 1.90, 4.60, and 7.20 times the risk of fatal overdose, respectively, among individuals with a chronic pain diagnosis. This finding held across subgroups of individuals defined by having a cancer diagnosis, an acute pain episode, or a substance use disorder (SUD). The effect estimates observed in the subgroups differed from the overall sample, pointing to the importance of assessing heterogeneity of effects. Furthermore, this association was also present in a VHA study with the outcome of fatal suicide, with no difference in effect size estimates for intentional overdoses versus other forms of suicide but lower effect sizes than for unintentional overdose (Ilgen et al., 2016). Additionally, studies in a number of non-VHA samples or studies focused on overdose mortality or all-cause mortality have resulted in similar inferences (Binswanger et al., 2022; Baumblatt et al., 2014; Dunn et al. 2010).
In addition to high achieved daily opioid dosages, rates of dosage escalation may contribute to mortality. However, only a limited number of studies have examined the effects of dosage escalation on mortality (Binswanger et al., 2022; Hser et al., 2020; Dunn et al., 2010) or other outcomes in the U.S. general population or within the VHA setting (Hayes et al., 2020; Salas et al., 2017; Henry et al., 2015). Studies of opioid dosage escalation in the VHA focused on outcomes other than mortality, including new-onset depression (Salas et al., 2017), SUDs, and non-mortality opioid-related adverse outcomes (Hayes et al., 2020). Salas and colleagues (2017) found that faster rates of dosage escalation contributed to new-onset depression independent of maximum dosage, pain scores, and total duration of opioid pharmacotherapy among veterans with new long-term opioid use who did not have depression at baseline. Among veterans with chronic non-cancer pain, Hayes and colleagues (2020) reported that escalating opioid dosages were associated with increased risks of subsequent SUDs and opioid-related adverse outcomes, including accidents resulting in wounds/injuries, alcohol- and medication-related accidents and overdoses, and self-inflicted injuries. Additionally, a non-VHA study using data from the California prescription drug monitoring program found that both faster opioid dosage escalations and higher eventual dosages contributed to heightened risk of all-cause mortality (Hser et al., 2019). A study conducted in three health systems in Colorado and Wisconsin identified five opioid dosing trajectories over a 1-year period: decreasing (tapering or discontinuation), high-dose increasing (dose escalation), and three stable trajectories (dosage maintenance). Compared with the stable dosing, dosage escalation was associated with increased risk of mortality (Binswanger et al., 2022).
Some conventional studies using electronic health records (EHRs) or claims data are designed in ways that immortal time bias is present: they lack a systematic definition of “time zero,” that is, a calendar date that is specific to an individual and akin to the date of randomization in a clinical trial. Having a systematically defined “time zero” in a study ensures that the beginning of follow-up time (the period for which the study team observes outcomes) and treatment initiation are synchronized. This is important because misalignment between follow-up time and treatment strategy assignment, sometimes referred to as “time-anchor misalignment,” can strongly bias the results of studies in a number of ways (Hernán et al., 2016). This is especially true when the outcome is all-cause or cause-specific mortality, although misalignment can bias studies with nonfatal outcomes as well (Liang et al., 2016).
In the context of studies of dosage increases, the focus of this chapter, clear potential biases can result from comparing individuals who have been prescribed opioid pharmacotherapy for different lengths of time and with varying treatment histories. Most notably, individuals who have tolerated high daily dosages for a long time are
likely different from those with limited opioid exposure in ways that are difficult to capture through medical records, especially in their propensity to have side effects and adverse reactions. For example, there may be “survival effects” when those likely to experience harms from opioid pharmacotherapy do so early within a course of treatment. This can introduce bias in the direction of underestimating the risk of high dosages because individuals will have been less likely to have had serious adverse effects if they progressed to higher daily dosages. Alternatively, if longer treatment durations increase risk of death independently from dosage, results will be biased to finding a harmful effect of dosage if time since starting treatment is not accounted for in the study design.
The committee noted that prior studies of opioid dosage on mortality both in and outside of the VHA have not used the target trial emulation (TTE) framework and are likely to have significant time-anchor misalignment (Hernán and Robins, 2016). As a result, a critical gap remains in understanding the relationship between opioid dosage increases and mortality among veterans. Given this gap, the committee determined that conducting a study using a causal inference–focused design on the effect of opioid dosage increases was an essential component of the statement of task to focus on “the effect of higher doses relative to lower doses of opioids.”
The objective of study 2 is to identify the causal effect of varying initial opioid dosage and varying dosage escalation strategies on the risk of all-cause mortality and suicide mortality among veterans receiving care at the VHA. To address the gaps in studies that have limited ability to infer causality, the committee used a TTE framework to emulate two randomized trials. In one emulated trial,1 individuals would be randomized to new dispensing of opioid pharmacotherapy at different baseline dosages. In the other, individuals would be randomized to different dosage escalation strategies. Treatments in each emulated trial occurred over the next 6 months. The primary outcome is all-cause mortality, and the secondary outcome is suicide mortality.
STUDY 2 METHODS
Study 2 aimed to answer the following research question: among veterans receiving care in the VHA who were newly dispensed2 full-agonist3 opioid pharmacotherapy between 2007−2019, what is the effect of different initial opioid dosage and escalation strategies on all-cause mortality (primary outcome) and suicide mortality (secondary outcome) within a 12-month follow-up period?
The committee designed this study, which is an analysis of observational data to emulate two target trials. Both examine all-cause mortality and suicide mortality as outcomes; study 2a examines initial opioid dosage, and study 2b examines dosage escalation. The target trial is the hypothetical randomized pragmatic trial that would have best answered the causal question. TTE framework has two steps: (1) specify the protocol of the target trial, and (2) specify how the target trial will be emulated using observational data. The TTE framework is useful because, when applied correctly, it helps to ensure comparison of realistic treatment strategies, avoids biases from misalignment of time anchors (time zero/index date), and uses enhanced statistical techniques for minimizing confounding (Gomes et al., 2022; Hernán and Robins, 2016).
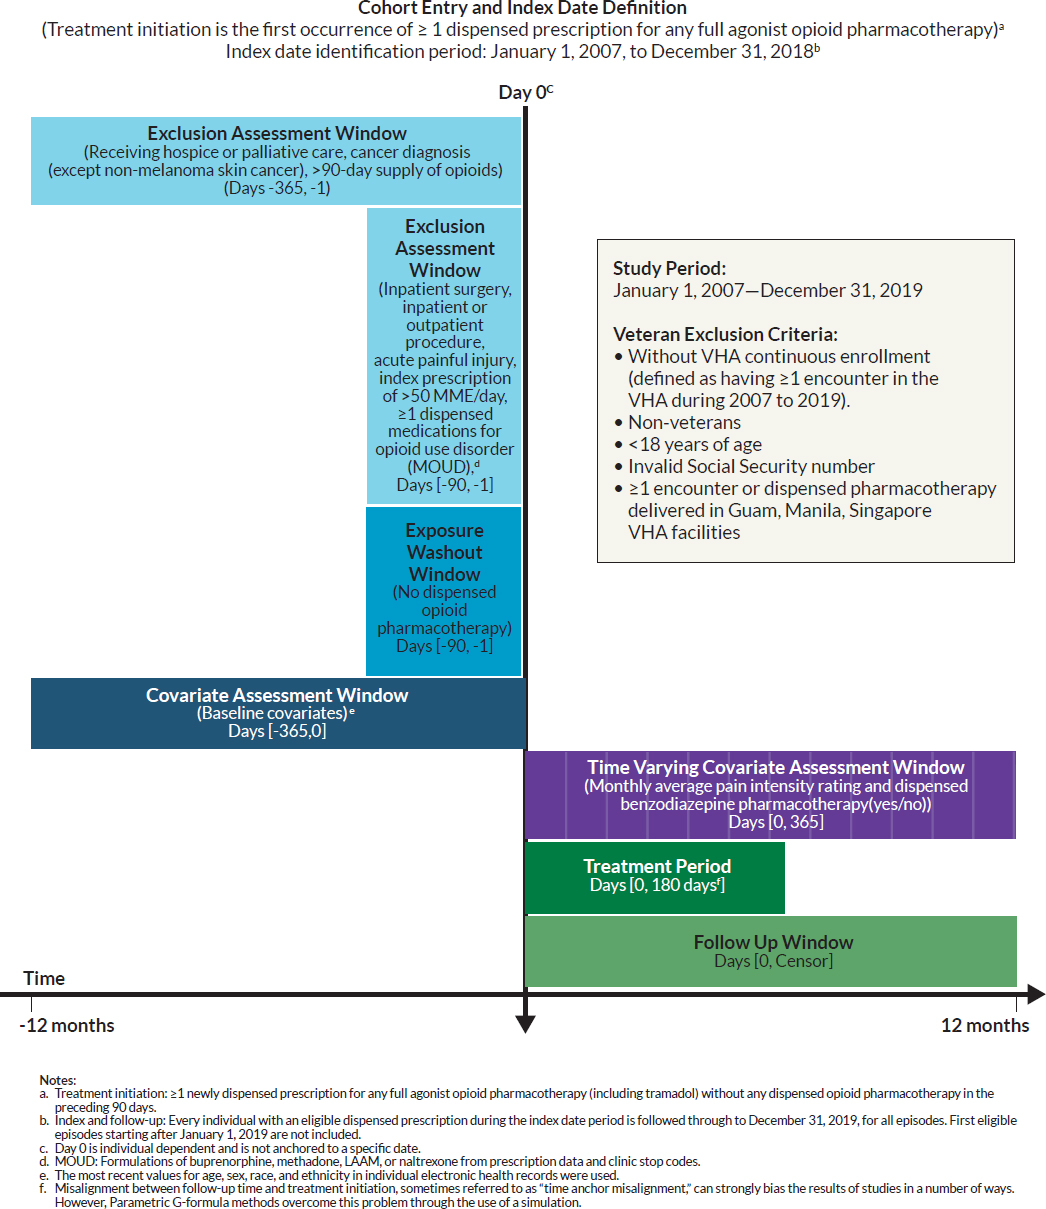
The protocol and specifications of the target trial and how the committee emulated the target trial using observational data are described in the following subsection and summarized in Table 5-1. In addition, given the complexity of each study, the committee developed Figure 5-1, which reflects key temporal aspects of the longitudinal study design, specifically the index or date of entry into the study, exposure washout period, windows for exclusion and covariate assessments, and follow-up time (Schneeweiss et al., 2019).
___________________
1 In this report, the committee uses the terms “emulated target trial” and “study” synonymously when referring to the committee’s studies and corresponding analyses.
2 The committee notes differences in types of pharmacy data measures. Pharmacy data can be categorized into three measures: prescribed (prescriber submits a prescription to a pharmacy), filled (pharmacy completes the requested prescription), and dispensed (individual picks up/is mailed the prescription from the pharmacy). The committee used dispensed pharmacy data in its analyses.
3 There are two types of opioids: full agonist and partial opioid agonist. Full opioid agonists fully activate the mu receptors in the brain, enabling the opioid to have “full” effect, such as morphine, codeine, oxycodone, and fentanyl. Partial opioid agonists also activate mu receptors in the brain but to a lesser degree, such as butorphanol or tapentadol.
TABLE 5-1 Specifications for Study 2 Target Trial Protocol
| Protocol Component | Target Trial | Target Trial Emulation |
|---|---|---|
| Eligibility Criteria |
|
Same as target trial |
| Baseline is defined at the first month in which all eligibility criteria are met. | ||
There were two separate trials:
|
||
| Treatment Strategies |
Trial 2a: (Initial Dosage Strategies (i.e., average dose in the first month after Day 0)): Each eligible individual is randomly assigned to one of three initial dosage strategies:
|
Same as target trial Defined the date of pharmacotherapy initiation to be the first calendar month of a dispensed pharmacotherapy. |
|
Trial 2b2: (Dosage Escalation Strategies, change per month in the treatment period) Each eligible individual is randomly assigned to one of three dosage escalation strategies:
|
||
| Treatment Assignment | Individuals are randomly assigned to a strategy at baseline and are aware of their assigned strategy. | Assumed randomized conditional on baseline covariates (sociodemographics, health conditions and behaviors, supplemental health insurance to VHA coverage, health care utilization, specific pharmacotherapies, facility, facility-level characteristic, and calendar month of eligible dispensed pharmacotherapy) |
| Protocol Component | Target Trial | Target Trial Emulation |
|---|---|---|
| Outcomes | Primary: All-cause mortality Secondary: Suicide mortality |
Same as target trial |
| Start and End of Follow-Up | For each individual, follow-up starts at strategy assignment or treatment initiation (baseline). Eligible individuals are followed from time until death (or death to other causes, in analysis of suicide mortality), cancer diagnosis (except non-melanoma skin cancer), receipt of hospice or palliative care during follow-up, and/or receipt of MOUD or naltrexone during follow-up, censoring by discontinuation or administrative end of follow-up at 12 months, whichever occurs first. |
Same as target trial |
| Causal Contrast | Per protocol effect The primary effect is the total effect of the specified intervention strategies on mortality through all causal pathways between the interventions and the outcome. For the secondary outcome of suicide, the primary effect includes causal pathways potentially mediated by death from other causes (a competing event). |
Observational analogue of per protocol effect |
| Statistical Analysis | Per protocol analysis. Parametric G-formula to compare risk under each treatment strategy (increasing baseline dosage; increasing escalation dosage) via mortality risk and risk ratio. Only eligible months with sustained treatment were included in the model building stage. | Same as target trial |
1 The committee determined a threshold of 50 Morphine Milligram Equivalents per Day (MMED) as the intent of the study was to look at opioid naïve individuals. Based on their clinical expertise, the committee determined that individuals prescribed a dose greater than 50 MMED would likely not be opioid naïve.
2 The committee arrived at these thresholds based on discussion with clinicians regarding usual trajectories in clinical practice, as well as clinical appropriateness of dosage strategies.
SOURCE: Adapted from Hernán and Robins, 2016, and NASEM, 2019.
Study Population and Data Sources
The study population was defined as veterans receiving care in the VHA, and the study period was from January 1, 2007, to December 31, 2019.4 The earliest index date, or start date, was January 1, 2007.5 The latest possible index date was December 31, 2018, to allow individuals to be followed for 12 months after being newly dispensed opioid pharmacotherapy. To assess exclusion and eligibility in the study and follow-up, data from 2006–2019 were pulled for analyses.
Data from the national VHA data files were linked to the VA Corporate Data Warehouse, U.S. Veterans Eligibility Trends and Statistics, National Death Index (NDI), and Medicare Parts A, B, C, and D data from the Centers for Medicare & Medicaid Services (CMS). Primary sources for individual inclusion/exclusion criteria and covariates were from VA and VHA data. CMS data were used to supplement individual data used for inclusion/exclusion and other covariates. Data files were linked based on a veteran’s unique individual integrated control number, Social Security number (SSN), and date of birth. The National Academies of Sciences, Engineering, and Medicine Institutional Review Board approved the study.
___________________
4 Latest possible index date was December 31, 2018, in study 2.
5 Given that the earliest index date is January 1, 2007, the earliest pre-index data are January 1, 2006.
NOTE: No cell sizes of 10 or less are included in the reported result.
SPECIFICATIONS FOR THE EMULATED TARGET TRIAL 2
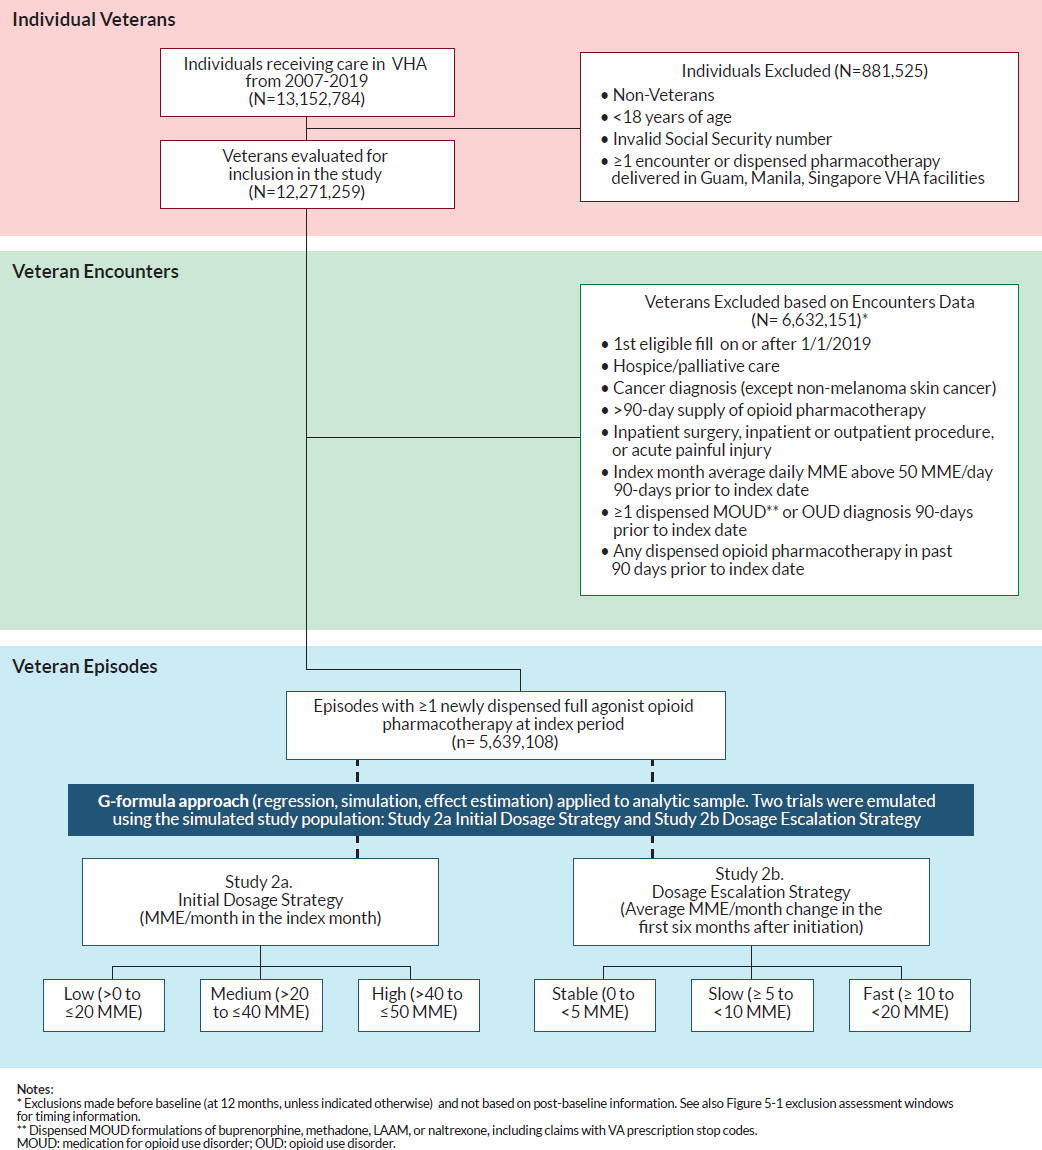
Drawing from this study population of all veterans who received care in VHA facilities, this study focused on those who were dispensed ≥1 any full agonist opioid (including tramadol) in the outpatient setting. Figure 5-2 illustrates the flowchart detailing the selection process of including eligible veterans in study 2. The following section outlines each of the TTE components for study 2.
Study 2 Eligibility Criteria
For each calendar month from January 1, 2007, to December 31, 2019, the committee identified eligible individuals who met the following criteria: (1) be a U.S. veteran; (2) be 18 years or older; (3) have a valid SSN; and (4) have at least 1-year continuous enrollment in the VHA between 2006–2019,6 defined as at least one encounter in the VHA in the 12-month pre-index period. Eligible individuals also included veterans with at least one encounter in the VHA in the 12 months before the index date within the eligible study period but only had a pharmacy claim through Medicare Part D (no VHA pharmacy claim). In addition, those who were eligible did not have an encounter or dispensed pharmacotherapy in Guam, Manila, Singapore VHA facilities. These veterans were excluded given that mortality data collected in these regions are not reflected in the NDI data. See “exclusion criteria” for further information.
To be eligible for study 2, VHA veterans had to have no dispensed opioid pharmacotherapy in the 90-day pre-index period (the exposure washout period). The committee established this washout period, based on the following considerations in addition to committee expertise (VHA, 2006):
- Maximum duration of any opioid prescription for non-hospice/non-palliative care is 90 days.
- The maximum duration of any prescription fill in the VA is 90 days, with exceptions for Schedule 2 drugs such as oxycodone prescriptions, which have a maximum duration of 30 days (except for individuals in hospice or palliative care).7
In addition, VHA veterans meeting the eligibility criteria must not have been dispensed8 full-agonist opioid analgesics, including tramadol, in the 90-day pre-index period (the exposure washout period) and 365 days preceding their index fill (i.e., dispensed full-agonist opioid pharmacotherapy) to ensure that eligible participants were newly dispensed opioid pharmacotherapy on the index date. Requiring a washout period facilitated the committee’s ability to examine the effects of opioid dosage increases among individuals newly dispensed an opioid pharmacotherapy and avoid the issues described that result from comparing across individuals with different treatment histories.
Study 2 Eligibility Exclusion
Study 2 had an exclusion assessment window of 365 days before the index date. VHA veterans who received hospice or palliative care or had a cancer diagnosis (except non-melanoma skin cancers) were excluded from the study. International Classification of Disease (ICD) diagnosis codes were used to identify conditions (see Appendix I for list of codes). Individuals receiving palliative care and/or in hospice were excluded given that having a terminal illness (and thus eligible for these services) is related to both death and more permissive use of opioid pharmacotherapy and thus is a confounder in the relationship between receiving opioid pharmacotherapy and death. In addition, individuals with cancer have an increased risk of mortality and often receive an opioid pharmacotherapy
___________________
6 Given that the earliest index date is January 1, 2007, the earliest pre-index data are January 1, 2006.
7 Hydrocodone was changed from a Schedule III drug to a Schedule II drug on October 6, 2014; before this, there could be 90-day fills of hydrocodone, which was common in VA and elsewhere.
8 The committee notes differences in types of pharmacy data measures. Pharmacy data can be categorized into three measures: prescribed (prescriber submits a prescription to a pharmacy), filled (pharmacy completes the requested prescription), and dispensed (individual picks up/is mailed the prescription from the pharmacy). The committee used dispensed pharmacy data in its analyses.
NOTE: No cell sizes of 10 or less are included in the reported result.
to manage cancer-related pain. Decisions regarding opioid initiation, co-prescribing, and dosage increases may differ for cancer compared to non-cancer pain; policies and practices for opioid prescribing is (generally) more permissive for individuals with cancer (VA/DoD, 2022, 2017, 2010, and 2003; Manchikanti et al., 2017; Dowell et al., 2016; Nersesyan and Slavin, 2007). Furthermore, study exclusion criteria are in line with published studies examining opioid pharmacotherapy, which exclude individuals with cancer (Song et al., 2022; Coyle et al., 2018; Berna et al., 2015; Turner and Liang, 2015; Gomes et al., 2011; Dunn et al., 2010). As a result, having cancer may be a confounder between treatment regimen and mortality, and individuals with cancer are excluded.
The committee excluded VHA veterans receiving medications for opioid use disorder (MOUD), formulation of levo-alpha acetyl methadol (LAAM), methadone (based on clinic stop codes), buprenorphine, or naltrexone), and/or initial opioid dosages of at least 50 MME/day9 in the 90-day pre-index period to reduce the likelihood of including those who were not truly opioid naïve. In addition, due to complexities to measuring MME exposure, the committee excluded any individuals in the population who had received ≥1 dispensed MOUD formulation of LAAM, methadone, buprenorphine, or naltrexone in the 90-day pre-index period.
Veterans with qualifying episodes10 beginning on or after January 1, 2019, were excluded to ensure that each veteran included in the study had the potential for a complete 12-month follow-up period.
Given the study’s causal question, additional exclusion criteria were applied. These criteria were designed to ensure that the study population was relevant to the causal question. The following individuals were excluded: those who had acute painful injury diagnoses, surgeries, procedures (based on current procedural terminology codes [also known as CPT codes]) in their EHRs in the 3 months prior to index date, because dosage increases are not an expected component of short-term or acute opioid prescribing.
Based on the inclusion/exclusion criteria listed, Figure 5-2 illustrates the flowchart detailing the selection process of veterans for the two emulated target trials.
Study 2 Treatment Strategies
Drawing from this study population of eligible veterans, this study considers the following clinically realistic treatment strategies. There were two studies conducted: study 2a: treatment groups were selected to represent alternative strategies for initial opioid dosage (see Table 5-2), and study 2b: escalation strategies over 6 months after initiation (i.e., from a daily dosage of 0) (study 2b) (see Table 5-3).
- For study 2a, the committee considered three initial dosage levels based on its clinical expertise and review of the observed distribution in the data: 1) >0 to ≤20 MME/day (low), 2) >20 to ≤40 MME/day (medium), and 3) >40 to ≤50 MME/day (high).
- The committee considered the following scenarios of opioid dosage escalation for study 2b: 1) stable dosage, an average of 0 to <5 MME/day increase per month for 6 consecutive months (stable), 2) an average of ≥5 to <10 MME/day increase per month for 6 consecutive months (slow), and 3) an average of ≥10 to <20 MME/day increase per month for 6 consecutive months (fast). The average MMEs to assign individuals to specific trajectories were calculated using a rolling average, adjusted to a 30-day average. See also Tables 5-2 and 5-3 for the categories.
The list of eligible opioid and non-opioid pain pharmacotherapies is in Table 5-4.
Study 2 Treatment Assignment
In the hypothetical target trial, eligible individuals would be randomly assigned by clinical researchers to a treatment strategy with their consent and followed; individuals would be aware of their treatment assignment. In the emulated target trial (study 2), based in retrospective observational data, treatment assignments were based on the observed dispensed prescription drug events (claims) from Medicare Part D or dispensed pharmacotherapies from the VHA EHRs. Thus, the analyses considered prescription dispensing records to assign treatment strategy,
___________________
9 Initial dosages higher than 50 MME/day or greater were unusual (7.21 percent of analytical sample).
10 All veteran episodes (regardless of treatment assignment).
TABLE 5-2 Study 2a: Initial Dosage Strategies
| Initial opioid dosage strategy (MME1/Day) |
| Low (>0 to ≤20) |
| Medium (>20 to ≤40) |
| High (>40 to ≤50) |
1 MME: Morphine milligram equivalent.
TABLE 5-3 Study 2b: Dosage Escalation Trajectories
| Dosage opioid escalation strategy (Average MME1/Day change in 6 months) |
| Stable (0 to <5) |
| Slow (≥5 to 10) |
| Fast (≥10 to <20) |
1 MME: Morphine milligram equivalent.
unlike in the hypothetical target trial, for which researchers would determine the treatment assignment, which could be different from what medications11 ultimately were dispensed. It is also important to distinguish the measurability of prescription dispensing data from the measurability of that which is ingested by the individual. A dispensed prescription does not necessarily mean that the medication was consumed, since these medications are commonly prescribed to be taken “as needed.” For this study, a measure of individuals ingesting the prescription was not available in the dataset analyzed; the committee used prescription dispensing data as a proxy for medications ingested by the individual. After the first dispensed eligible pharmacotherapy, 30-day pharmacotherapy episode interval was created for eligible veterans.
Selection of Pharmacotherapies of Interest and Measures in Study 2.
Using a combination of VA and Medicare Part D data, the committee identified full opioid agonists for pain management, excluding MOUD (see Table 3-4 for a complete list of eligible medications). To specify the newly dispensed opioid pharmacotherapy, individuals with only full agonists (including tramadol) were considered eligible for the opioid-exposed group; however, once in that group, individuals could additionally be dispensed atypical opioid pharmacotherapy (tapentadol or butorphanol). The MMEs from these pharmacotherapies were included in the total dosage calculations of the group.
Measuring Opioid Dosage.
The intensity of opioid use was measured based on MMEs, which is ideal because it standardizes dispensed opioid pharmacotherapy considering differences in the potency, quantity, and strength of different types of opioid pharmacotherapy. The committee excluded injectable opioid pharmacotherapy because they have different MME conversion factors from oral opioid pharmacotherapy and are uncommon in outpatient settings. The committee calculated MMEs using conversions from the CDC (Dowell et al., 2022). The committee measured the mean daily MME dosage per 30-day period using an “on-therapy days,” as defined in Dasgupta and colleagues (2021), which accounts for overlapping opioid prescriptions with no gap allowances made for early refills. The numerator is the sum of MMEs across all prescriptions dispensed in discrete 30-day periods of time from the index date. The denominator is the total number of unique days with opioid exposure based on days’ supply, counting overlap days once. Dispensed opioid pharmacotherapy data with missing variables (e.g., days’ supply, National Drug Code) required to calculate MMEs were excluded (Dasgupta et al., 2016).
___________________
11 The committee uses the term “pharmacotherapy” throughout the report instead of “medications,” “prescriptions,” or “treatment,” especially when referencing the committee’s analyses and results.
TABLE 5-4 Pharmacotherapies of Interest in Study 2
| Drug Class | Study 2 |
|---|---|
| Opioid Full Agonist | |
| Benzhydrocodone | Opioid pharmacotherapy (Treatment) |
| Codeine | Opioid pharmacotherapy (Treatment) |
| Dihydrocodeine | Opioid pharmacotherapy (Treatment) |
| Fentanyl | Opioid pharmacotherapy (Treatment) |
| Hydrocodone | Opioid pharmacotherapy (Treatment) |
| Hydromorphone | Opioid pharmacotherapy (Treatment) |
| LAAM1 (non-liquid; for pain) | Opioid pharmacotherapy (Treatment) |
| LAAM (non-liquid; MOUD2) |
|
| Levomethadyl | Opioid pharmacotherapy (Treatment) |
| Levorphanol | Opioid pharmacotherapy (Treatment) |
| Meperidine (oral) | Opioid pharmacotherapy (Treatment) |
| Methadone (non-liquid/non-diskette) (for pain) | Opioid pharmacotherapy (Treatment) |
| Methadone (non-liquid/non-diskette) (MOUD) |
|
| Morphine | Opioid pharmacotherapy (Treatment) |
| Oxycodone | Opioid pharmacotherapy (Treatment) |
| Oxymorphone | Opioid pharmacotherapy (Treatment) |
| Propoxyphene | Opioid pharmacotherapy (Treatment) |
| Sufentanil (sublingual) | Opioid pharmacotherapy (Treatment) |
| Tramadol | Opioid pharmacotherapy (Treatment) |
| Opioid Atypical | |
| Buprenorphine (MOUD) |
|
| Buprenorphine (for pain) |
|
| Butorphanol |
|
| Tapentadol |
|
| Opioid Antagonist | |
| Naltrexone |
|
| Drug Class | Study 2 |
|---|---|
| Benzodiazepine | |
| Alprazolam | Confounder |
| Bromazepam | Confounder |
| Chlordiazepoxide | Confounder |
| Clobazam | Confounder |
| Clonazepam | Confounder |
| Clorazepate | Confounder |
| Diazepam | Confounder |
| Estazolam | Confounder |
| Flurazepam | Confounder |
| Halazepam | Confounder |
| Lorazepam | Confounder |
| Oxazepam | Confounder |
| Prazepam | Confounder |
| Quazepam | Confounder |
| Remimazolam | Confounder |
| Temazepam | Confounder |
| Triazolam | Confounder |
| Anti-Convulsant | |
| Carbamazepine | Confounder |
| Oxcarbazepine | Confounder |
| Topiramate | Confounder |
| Antidepressants | |
| Amitriptyline | Confounder |
| Amoxapine | Confounder |
| Bupropion (Tab) | Not included in study |
| Citalopram | Not included in study |
| Clomipramine | Confounder |
| Desipramine | Confounder |
| Desvenlafaxine | Confounder |
| Doxepin | Confounder |
| Duloxetine | Confounder |
| Escitalopram | Not included in study |
| Esketamine | Not included in study |
| Fluoxetine | Not included in study |
| Fluvoxamine | Not included in study |
| Impramine | Confounder |
| Isocarboxazid | Not included in study |
| Drug Class | Study 2 |
|---|---|
| Levomilnacipran | Confounder |
| Milnacipran | Confounder |
| Mirtazapine | Confounder |
| Nefazodone | Not included in study |
| Nortriptyline | Confounder |
| Paroxetine | Not included in study |
| Phenelzine | Not included in study |
| Protriptyline | Confounder |
| Selegiline | Not included in study |
| Sertraline | Not included in study |
| Tranylcypromine | Not included in study |
| Trazodone | Not included in study |
| Trimipramine | Confounder |
| Venlafaxine | Confounder |
| Vilazodone | Not included in study |
| Viloxazine | Not included in study |
| Vortioxetine | Not included in study |
| Antihistamine | |
| Hydroxyzine | Confounder |
| Anxiolytic | |
| Buspirone | Confounder |
| Gabapentinoids | |
| Gabapentin | Confounder |
| Pregabalin | Confounder |
| Insomnia | |
| Eszopiclone | Not included in study |
| Ramelteon | Not included in study |
| Suvorexant | Not included in study |
| Zaleplon | Not included in study |
| Zolpidem | Not included in study |
| Migraine | |
| Almotriptan | Confounder |
| Aspirin w/ caffeine | Confounder |
| Eletriptan | Confounder |
| Fioricet | Confounder |
| Fioridals | Confounder |
| Fioridan | Confounder |
| Frovatriptan | Confounder |
| Naratriptan | Confounder |
| Drug Class | Study 2 |
|---|---|
| Rizatriptan | Confounder |
| Sumatriptan | Confounder |
| Sumatriptan + Naproxen | Confounder |
| ZOLMitriptan | Confounder |
| Muscle Relaxers | |
| Baclofen | Confounder |
| Carisoprodol | Confounder |
| Chlorzoxazone | Confounder |
| Cyclobenzaprine | Confounder |
| Dantrolene | Confounder |
| Metaxalone | Confounder |
| Methocarbamol | Confounder |
| Orphenadrine | Confounder |
| Tizanidine | Confounder |
| Other Non-Opioid Analgesic | |
| Acetaminophen | Confounder |
| Non-Steroidal Anti-Inflammatory Drugs | |
| Aspirin (>=400mg) | Confounder |
| Celecoxib | Confounder |
| Diclofenac (pill) | Confounder |
| Diflunisal | Confounder |
| Etodolac | Confounder |
| Fenoprofen | Confounder |
| Flurbiprofen | Confounder |
| Ibuprofen | Confounder |
| Indomethacin | Confounder |
| Ketoprofem | Confounder |
| Ketorolac | Confounder |
| Meclofenamate | Confounder |
| Meloxicam | Confounder |
| Nabumetone | Confounder |
| Naproxen | Confounder |
| Oxaprozin | Confounder |
| Phenylbutazone | Confounder |
| Piroxicam | Confounder |
| Salsalate | Confounder |
| Sulindac | Confounder |
| Tolmetin | Confounder |
| Drug Class | Study 2 |
|---|---|
| Serotonin-Norepinephrine Reuptake Inhibitor | |
| Desvenlafaxine | Confounder3 |
| Venlafaxine | Confounder3 |
| Tetracyclic Antidepressant | |
| Mirtazapine | Confounder3 |
1 LAAM: Levo-Alpha Acetyl Methadol.
2 MOUD: Medication for opioid use disorder.
3 Desvenlafaxine, venlafaxine, and mirtazapine are included in study 2 in the antidepressant covariate.
Study 2 Start and End of Follow-Up
The start date, or index date, is when the eligible veteran was first dispensed the qualifying ≥ 1 full-agonist opioid medication and when all baseline eligibility criteria were met. To facilitate computation, the index date was transformed into an index month, and all analyses were conducted using aggregated monthly data. Based on the study design that considered a 12-month pre-index period and a 12-month follow-up period, January 1, 2007, was the first eligible index date and December 31, 2018, was the last eligible index date. The committee utilized all available follow-up data (through the end of 2020) with prespecified landmark analysis at 12 months.
To estimate the effect of opioid dosage escalation on mortality, the analysis limited follow-up to 12 months. The study timeline start is based on the calendar month in which the individual was dispensed the index prescription.12
For the per protocol analysis, given that interest is in observing the effect of initiating and continuing the treatment strategy over a specified follow-up period, eligible individuals are followed from treatment initiation (baseline) until death (or death due to other causes in analysis of suicide mortality), cancer diagnosis (except non-melanoma skin cancer), receipt of hospice or palliative care, or the administrative end of follow-up (at the end of 12 months from baseline), whichever happens first.
Outcomes
The outcomes outlined in the statement of task are all-cause mortality and suicide mortality, which were identified through linked data from NDI. The committee determined all-cause mortality as the primary outcome and suicide mortality as the secondary outcome. Suicide mortality is identified by the ICD-10 death codes X60-X84 (intentional self-harm), U03 (intentional self-harm (suicide)), and Y87.0 (sequelae of intentional self-harm) (Hirsch et al., 2016; CDC, 2002).
Causal Contrast: Per Protocol Effect
The causal contrast for study 2 was the per protocol effect. The parametric G-formula was used to estimate the per protocol effect. This approach is useful for studying interventions that are defined as a course of a stable treatment for a certain length of time or one that changes under specific conditions (i.e., a dynamic treatment strategy). A common issue with studying sustained treatment strategies is the problem of misalignment of time anchors. Parametric G-formula methods overcome this via simulation. The general assumptions of this approach are the same as other trial emulations–if there are no unmeasured confounders, no measurement error, and no
___________________
12 For example, a dispensed index prescription on July 11, 2017, means that July 2017 is month 1 for the participant. MME/month are adjusted; for example the MME/month for an individual dispensed an opioid prescription would be an average over 21 days, or from July 11 to 31).
model misspecification, the per protocol effect provides unbiased estimates of causal effects. See chapter 3 for a detailed description of all the assumptions associated with this approach.
Study 2 Study Design
This study design was an active comparator new user (Lund et al., 2015; Ray, 2003), retrospective cohort TTE (Hernán and Robins, 2016). For this study, the committee sought to emulate a pragmatic clinical trial in which individuals are randomized to one of three initial baseline opioid dosages (study 2a) or one of several dosing strategies over a 6-month treatment period (study 2b).
Study 2 Covariates
To strengthen causal inferences, the committee controlled for many covariates to adjust for baseline and/or time-varying confounding and achieve balance between the treatment and comparator groups:
- Sociodemographics,
- Health conditions and behaviors,
- Supplemental health insurance to VHA coverage,
- Health care utilization,
- Specific pharmacotherapies,
- Facility-level characteristics,
- Facility, and
- Calendar month of eligible dispensed pharmacotherapy.
Additional covariates include month and the interaction between state and year as fixed effects. Baseline covariates included demographic characteristics (e.g., age, sex, race/ethnicity, marital status, disability status), supplemental insurance to VHA coverage (i.e., Medicare, TRICARE, or private insurance), housing security (e.g., history of homelessness status), physical and mental health conditions (e.g., acute painful injury, anxiety, chronic obstructive pulmonary disease, cardiovascular disease, SUDs, diabetes), military status (e.g., service era, military branch, combat service), body mass index, health care utilization in prior year (e.g., VHA outpatient visits, inpatient hospital admissions, nursing home stay), VHA facility-level characteristic (e.g., urbanicity), and specific pharmacotherapies that the committee considered as potential confounders (such as migraine pharmacotherapy, anxiolytic, benzodiazepines; see Table 3-4 and Table 5-4 for the detailed list). The committee evaluated candidate variables readily available in the study clinical and administrative databases (see Appendix I for a list of all health conditions and corresponding ICD codes).
The studies did not require participants to have a chronic pain diagnosis in the primary analysis. Studies have shown that individuals identified with chronic pain did not have a pain diagnosis or pain was underreported in electronic medical records compared to pain reported in a patient-based survey (Frank et al., 2019; Goulet et al., 2016)
Time-Varying Covariates
The time-varying covariate included pain intensity ratings (measured by the average of all documented pain scores within a month in the VA EHR) and receipt of any benzodiazepine prescriptions during the follow-up period. The time-varying covariate was updated monthly in the dataset. When a new measurement was unavailable, the last observation was carried forward indefinitely until a new measurement was available or the individual was censored.
Accounting for Secular Trends and Variation by Facility
Facility and calendar time (12 months) were captured as fixed effects to capture facility-specific variation (e.g., clustering of individuals within a facility, geographic variation by facility) and reflect changes over time
(e.g., variation in behaviors [health care seeking, prescribing]) and prevalence of conditions during a year. The committee also included the interaction term (i.e., product term) between state and year to capture variation over time and by states, such as when state or facility policies related to opioid prescription were implemented (e.g., when states began to participate in the Prescription Drug Monitoring Program) or secular trends in state-level policies and intensities during the opioid epidemic.
Statistical Analyses
Parametric G-Formula
The committee applied the parametric G-formula to estimate the causal effect of specific patterns of opioid dosage escalation on all-cause mortality and suicide mortality. A key strength of the G-formula method is that it can estimate effects of sustained treatment strategies, as in the case of dosage adjustments under a “titrate until pain control is achieved” protocol. This is in contrast with “time point interventions,” such as “start opioids for pain.” A common issue with studying sustained treatment strategies is the problem of misalignment of time anchors, which can lead to several types of bias (Hernán et al., 2016). Specifically, because sustained treatment strategies lack a single time anchor, it is impossible to correctly align the treatment group assignment time anchor with the timing of eligibility assessment and start of follow-up. Parametric G-formula methods overcome this problem via simulation.
Compared to traditional observational study methods, the parametric G-formula also can address confounding when it is due to complex relationships over time, such as past-exposure-affected time-varying confounding, defined as when past treatment has a causal relationship with current covariates, which are related to future treatment and outcomes. In this study, an example is when prior opioid dosage influences the pain level, which influences both whether the opioid dosage is changed at the next appointment and risk of suicidality. Because the G-formula can appropriately handle time-varying confounding, it can account for the post-baseline factors related to adherence to a specific opioid dosage pattern when estimating the effect of those patterns on outcomes. An alternative option would be the “clone, censor, weight” approach, which can also incorporate time-varying confounding adjustment and be used to measure sustained treatment strategies, via the clone component. However, the committee was interested in estimating the causal effect of specific, well-defined opioid dosage trajectories to best mimic a clinical trial and aid interpretability of findings. The G-formula facilitates modeling of very specific dosage trajectories. Also, the G-formula was applied to studies 2a and 2b to ensure the same sample is included in both, which would allow direct comparison of the results between both studies and evaluate the relative importance of the two aspects of prescribed dosage. In summary, the committee selected the parametric G-formula because of its ability to address time-varying confounding and ensure time-anchor alignment with treatment strategies that accrue over time and because the committee is interested in estimating the impact of specific, sustained dosing strategies (e.g., 10 percent increase per month) rather than all dosing trajectories present in the data.
Broadly, the modeling strategy of the parametric G-formula is a three-step process: (1) generate prediction models using regression for all time-varying covariates used in the study and the outcome, both conditional on observed treatment and covariate history, (2) conduct Monte Carlo simulation to iteratively estimate the outcome at each follow-up time if all individuals in the sample received a specific treatment strategy (repeated for each treatment strategy), and (3) use bootstrapping (repeating steps 1 and 2) to generate standard errors for the risk estimates. The options for a threshold intervention and lag functions13 for employing the G-formula to the study.
For the present study, using a survival time-based outcome assessment, the G-formula method produces estimates of the contrasts in failure risks (death) over 12 months between the comparator dosage strategies. This study evaluated two different components of opioid dosages in two separate analyses: (1) initial dispensed dosage (measured as average MME/day in the index month) and (2) dosage escalation (measured as the average MME/day change per month in the first 6 months after initiation). The initial dosage strategies were low (>0 to ≤20 MME/day, reference), medium (>20 to ≤40 MME/day), and high (>40 to ≤50 MME/day) in the index month.
___________________
13 In the committee’s analysis, the lag function refers to the following function: the G-formula uses prior months in the analysis for estimation of adherence and outcome. The committee used 1 month prior in the formula.
The dosage escalation strategies were stable (0 to <5 MME/day, reference), slow (≥5 to <10 MME/day), and fast ≥10 to <20 MME/day), measured as a change per month and sustained for 6 consecutive months. The committee estimated prediction models for 12 intervals, 1 for each month in the year; measurements in each interval varied by time-varying covariates and individuals who were censored.
Within the simulation step of the G-formula, the veterans are “assigned” the intervention to estimate the outcome as if they had received that level of the intervention. For example, in the low initial dosage strategy of study 2a, the simulated study population is assigned an MME/day of 0–20 as their initial dispensed dosage and followed over 12 months to estimate their predicted risk of mortality overall. The risk of mortality (as a measure of absolute risk), expressed as a percent dying over 12 months, was then estimated for each initial dosage strategy and dosage escalation strategy. In addition, the risk ratio (RR) compared each treatment strategy to its reference. The committee estimated G-formula models three different treatment strategies in the initial dosage strategies study (study 2a) and also for the escalation dosage strategies study, for a total of six models for each treatment strategy. Confidence intervals (CIs) were calculated using the percentile method from 400 bootstrap samples (Davidson and MacKinnon, 2001). The committee used the following options in the G-formula approach in SAS software (Logan et al., 2022; McGrath et al., 2020): a time-varying indicator of failure (death or fatal suicide) and lagged month of data for time-varying covariates. Individuals were censored in the month of their censoring event using the censor option in the G-formula macro “call.”
All analyses were conducted using SAS 9.4 and SAS Enterprise Guide. Study results do not report data if sample sizes were 10 or fewer individuals. This helps to ensure confidentiality of individuals in the study and be in line with CMS data policy and National Center for Health Statistics (NCHS) recommendations (NCHS, 2023; HHS, 2020). Furthermore, cells are marked as unreliable where sample sizes were 20 or fewer.
Descriptive Analyses
The committee reported the distributions of baseline demographic and clinical characteristics for the overall analytic sample.
Subgroup Analyses
Given the challenges in computing capacity and processing time, analyses on subgroups (e.g., by age, gender, race, and ethnicity) or sensitivity analyses were not conducted.
RESULTS
Among the 13,152,784 million unique veterans who received care in the VHA 2007–2019, 5,639,108 individuals qualified for inclusion in modeling. Of the individuals in the final analytic sample, there were 52,809 observed all-cause mortality deaths and 767 suicide mortality deaths in the 12 months following the index date. The characteristics of the final sample are presented in Table 5-5. As in VHA veterans in general, the sample was largely male (92.70 percent). The mean age of the population was 59.86 years (SD14: 16.32). By race, the population was White (71.46 percent), Black (16.21 percent), Asian (0.80 percent), Native American (0.49 percent), Pacific Islander (0.70 percent), of multiple races (0.80 percent), and those with a missing race category (9.54 percent). By ethnicity, individuals were non-Hispanic (88.73 percent), Hispanic (5.41 percent), and of missing ethnicity (5.86 percent).
The G-formula estimate for the natural course, which is the estimated percent of the study population that would die by 12 months based on the simulation models, was 4.37 percent (SE: 0.15) for the model for initial dosage strategy (study 2a) and 4.57 percent (SE: 0.16) for the model for escalation dosage strategy (study 2b). The observed risk in this study population was 6.26 percent. The difference between the natural course estimate that results from simulation models and the observed rate may reflect the impact of censoring and or imprecision in the model.
___________________
14 Standard deviation
| Covariates | Percentage % (or mean) | Standard Deviation |
|---|---|---|
| Sex | ||
| Male | 92.70 | |
| Female | 7.30 | |
| Age (Continuous) | (59.86) | (16.325) |
| Race | ||
| White | 71.46 | |
| Black | 16.21 | |
| Asian | 0.80 | |
| Native American | 0.49 | |
| Pacific Islander | 0.70 | |
| Multiracial | 0.80 | |
| Missing | 9.54 | |
| Ethnicity | ||
| Non-Hispanic | 88.73 | |
| Hispanic | 5.41 | |
| Missing | 5.86 | |
| Marital Status | ||
| Married | 53.20 | |
| Unmarried | 44.30 | |
| Missing | 2.50 | |
| Disability Status (Based on VA1 Enrollment Priority Group) | ||
| Enrollment Group 1 | 22.83 | |
| Enrollment Group 2 | 7.54 | |
| Enrollment Group 3 | 11.84 | |
| Enrollment Group 4 | 1.37 | |
| Enrollment Group 5 | 35.53 | |
| Enrollment Group 6 | 4.43 | |
| Enrollment Group 7 | 3.02 | |
| Enrollment Group 8 | 13.25 | |
| Missing | 0.27 | |
| Housing Security | ||
| History of Homelessness (yes/no) | 10.80 | |
| Health Behavior | ||
| Tobacco Use Ever (Yes/No) | 45.08 | |
| Health Conditions | ||
| Physical Health Conditions | ||
| Pain Conditions | ||
| Abdominal pain | 11.58 | |
| Back Pain | 22.78 | |
| Covariates | Percentage % (or mean) | Standard Deviation |
|---|---|---|
| Fibromyalgia | 1.47 | |
| Fractures | 6.22 | |
| Headaches | 5.54 | |
| Limb Pain | 38.96 | |
| Musculoskeletal Pain | 8.15 | |
| Neck Pain | 6.56 | |
| Neuropathy | 7.23 | |
| Orofacial Pain | 0.70 | |
| Systemic Disorders | 1.68 | |
| Urogenital Pain | 1.92 | |
| Other | 6.59 | |
| AIDS/HIV | 0.46 | |
| Blood Loss Anemia | 1.06 | |
| Cardiovascular Disease | 17.53 | |
| Cerebrovascular Disease | 4.41 | |
| Chronic Lung Disease | 13.14 | |
| Cirrhosis | 0.76 | |
| COPD2 | 2.40 | |
| Deficiency Anemia | 4.81 | |
| Dementia | 2.33 | |
| Diabetes | 21.94 | |
| End Stage Renal Disease | 0.68 | |
| Heart Disease | 17.34 | |
| Hepatitis | 1.41 | |
| Hemiplegia or Paraplegia | 0.58 | |
| Liver Disease | 1.92 | |
| Migraine | 2.31 | |
| Peptic Ulcer Disease | 0.56 | |
| Peripheral Vascular Disease | 3.78 | |
| Pulmonary Circulation Disorders | 0.17 | |
| Renal Disease | 5.06 | |
| Rheumatic Disease | 40.64 | |
| Syncope | 0.53 | |
| Sleep Disorders | ||
| Apnea | 4.43 | |
| Insomnia | 1.19 | |
| Mental Health | ||
| Attention-Deficit/Hyperactivity Disorder | 0.19 | |
| Alcohol Use Disorder | 3.49 | |
| Anxiety | 5.20 |
| Covariates | Percentage % (or mean) | Standard Deviation |
|---|---|---|
| Bipolar Disorder | 1.57 | |
| Depression | 10.10 | |
| Substance Use Disorder | 1.77 | |
| Opioid Overdose | 0.01 | |
| Posttraumatic Stress Disorder | 9.43 | |
| Schizophrenia and Psychosis | 1.16 | |
| Suicidal Ideation | 0.26 | |
| Traumatic Brain Injury | 1.15 | |
| Average Pain Intensity Rating (at baseline) (VHA Vital Signs data) (Range 1–10) | (4.50) | (2.86) |
| Pain Score at Baseline | ||
| 0 | 13.86 | |
| 1 | 3.75 | |
| 2 | 4.89 | |
| 3 | 6.58 | |
| 4 | 6.97 | |
| 5 | 7.52 | |
| 6 | 6.40 | |
| 7 | 6.50 | |
| 8 | 6.81 | |
| 9 | 3.35 | |
| 10 | 3.39 | |
| Missing | 29.97 | |
| BMI | ||
| Underweight | 0.90 | |
| Normal | 17.80 | |
| Overweight | 32.30 | |
| Obese | 41.40 | |
| Missing | 7.60 | |
| Health Care Coverage | ||
| Supplemental Health Insurance to VHA Coverage | 46.82 | |
| Medicare (ever/never) | 18.21 | |
| Health Care Utilization in past year | ||
| Number of VA Outpatient Visits | ||
| VA Outpatient Visits (0–3) | 16.33 | |
| VA Outpatient Visits (4–11) | 20.86 | |
| VA Outpatient Visits (12–21) | 20.00 | |
| VA Outpatient Visits (22–42) | 22.13 | |
| VA Outpatient Visits (43–67) | 10.56 | |
| VA Outpatient Visits (68+) | 10.11 | |
| Covariates | Percentage % (or mean) | Standard Deviation |
|---|---|---|
| Inpatient Hospital Admission | 0.07 | |
| Nursing Home Visit | ||
| Nursing Home Visit (Yes/No) | 0.35 | |
| Military Status | ||
| Service Era | ||
| Peacetime, only | 24.12 | |
| Vietnam | 39.99 | |
| Gulf War | 18.66 | |
| Korean War | 7.89 | |
| Multiple Eras | 3.38 | |
| WWII, only | 5.00 | |
| Missing | 1.64 | |
| Combat Service (yes/no) | ||
| Combat Service | 14.32 | |
| Military Sexual Trauma, yes/no | ||
| Military Sexual Trauma | 5.00 | |
| Military Branch | 0.00 | |
| Army | 48.49 | |
| Coast Guard | 0.69 | |
| Air Force | 11.37 | |
| Marines | 8.27 | |
| National Guard | 0.01 | |
| Navy | 16.27 | |
| Missing | 14.87 | |
| Prescription Information (dispensed within 90 days before baseline, Yes/No) | ||
| Opioid Formulation | ||
| Any Long Acting | 1.00 | |
| Benzo Co-Prescription (≥1 benzo tablet dispensed during episode month) | 6.73 | |
| Prescription Information (dispensed within 90 days before baseline, Yes/No) | ||
| Gabapentinoids | 5.82 | |
| Anticonvulsant | ||
| Carbamazepine | 0.26 | |
| Oxcarbazepine | 0.06 | |
| Topiramate | 0.50 | |
| Antidepressant | 14.81 | |
| Antihistamine | ||
| Hydroxyzine | 1.42 | |
| Anxiolytic | ||
| Buspirone | 0.69 | |
| Migraine Pharmacotherapy | 1.50 | |
| Covariates | Percentage % (or mean) | Standard Deviation |
|---|---|---|
| Muscle Relaxers | 11.58 | |
| NSAIDs3 | 74.30 | |
| Acetaminophen | 67.39 | |
| Facility urbanicity | ||
| Non-Core | 22.83 | |
| Micropolitan | 7.54 | |
| Small Metropolitan | 11.84 | |
| Medium Metropolitan | 1.37 | |
| Large Fringe Metropolitan | 35.53 | |
| Large Central Metropolitan | 4.43 | |
| Missing | 15.88 | |
1 Department of Veterans Affairs.
2 COPD: chronic obstructive pulmonary disease.
3 NSAID: Non-steroidal anti-inflammatory drugs.
NOTES: No cell sizes of 10 or less are included in the reported result. Baseline characteristics as well as missingness are not comparable across trials as the cohorts for each study are distinct, due to study specific differences in inclusion and exclusion criteria.
Table 5-6 presents the results of the primary G-formula modeling for the initial opioid dosage strategies (study 2a). Table 5-7 presents the results of the primary G-formula modeling for the dosage escalation strategies. Results for suicide mortality were not reported, given sample size constraints. Specifically, few suicide mortality events occurred before censoring due to stopping opioid pharmacotherapy, resulting in few observed suicide deaths while veterans were active in opioid treatment on which to base modeling.
See supplementary Table 5-8 for additional details on missingness.
DISCUSSION
This study estimated the effect of initial opioid dosages and dosage escalation over 6 months on mortality among veterans newly dispensed opioid pharmacotherapy. Several studies established an association of higher versus lower opioid dosages with all-cause mortality and suicide mortality (Binswanger et al., 2022; Kaplovitch et al., 2015; Gomes et al., 2011; Bohnert et al., 2011b; Dunn et al., 2010). Studies among veterans have particularly
| Initial dosage strategya (MME/Day) |
Risk Estimate (%) |
Bootstrap Standard Error | 95% CIb | Risk Ratio | 95% CIb |
|---|---|---|---|---|---|
| Low (>0 to ≤20) | 3.95 | 0.16 | 3.69–4.29 | 1.00 (Ref) | (Ref) |
| Medium (>20 to ≤40) | 4.89 | 0.19 | 4.55–5.33 | 1.24 | 1.20–1.28 |
| High >40 to ≤50) | 5.80 | 0.19 | 5.44–6.24 | 1.47 | 1.44–1.50 |
a Initial dosage strategy is calculated as the average morphine milligram equivalent (MME)/day during the index month. The MME is a measure of the intensity of opioid exposure; it standardizes opioid prescriptions considering differences in the potency, quantity, and strength of different types of dispensed opioids. The committee calculated MMEs using CDC conversions.
b CIs were calculated using the percentile method from 400 bootstrap samples.
NOTES: No cell sizes of 10 or less are included in the reported result.
| Dosage escalation strategya (Average MME/Day change in 6 months) |
Risk Estimate (%) |
Bootstrap Standard Error | 95% CIb | Risk Ratio | 95% CIb |
|---|---|---|---|---|---|
| Stable (0 to <5) | 2.70 | 0.18 | 2.34–3.08 | 1.00 (Ref) | (Ref) |
| Slow (≥5 to <10) | 4.56 | 0.17 | 4.27–4.92 | 1.69 | 1.53–1.89 |
| Fast (≥10 to <20) | 4.69 | 0.17 | 4.39–5.06 | 1.74 | 1.57–1.94 |
a Dosage escalation strategy is calculated as the average morphine milligram equivalent (MME)/day change in 6 months. The MME is ideal to measure the intensity of opioid exposure; it standardizes opioid prescriptions considering differences in the potency, quantity, and strength of different types of dispensed opioids. The committee calculated MMEs using CDC conversions.
b CIs were calculated using the percentile method from 400 bootstrap samples.
NOTE: No cell sizes of 10 or less are included in the reported result.
shown that those who received higher opioid dosages for pain treatment had a higher risk of suicide and self-harm (Hayes et al., 2020; Ilgen et al., 2016). All of these earlier studies used conventional observational methods, whose designs (e.g., lack of a specific “time zero,” time-anchor misalignment) may contribute to biases that can impact the results. The present study used methods designed to estimate causal effects from observational data.
One key difference between this study and others was the use of G-formula methods to handle complex time-varying confounding. A second key difference was the committee’s application of a new user design to improve the rigor of the design and validity of comparisons. Because several years typically pass before individuals escalate to very high dosages, the new user design inherently limited the highest dosage levels that could be examined in the present study.
In a well-powered nested case-control study from Canada, MME/day levels of 20–100 were associated with odds ratios of 1.32–2.04 for the outcome of all-cause mortality, compared to MME/day levels of 1–19 (Gomes et al., 2011). These dosage levels are similar to those that may be achieved after 6 months under the initial dosage and dosage escalation strategies examined in the present study, and the dosage levels of the comparator groups are also similar between studies. Although improved methods to ensure comparability between treatments (i.e., dosage levels) may also explain some of the smaller effect sizes for the present study compared to this and other studies, the findings are generally consistent with one another. However, the present study findings suggested a threshold effect after which faster dosage escalation does not confer greater risk of death, whereas other studies focused on overdose-mortality specifically have generally found dose–response effects (Gomes et al., 2011).
The findings from this analysis should be considered in light of some limitations. First, only veterans who were newly dispensed full-agonist opioid pharmacotherapy were included; therefore, the findings may not generalize to veterans who initiated partial agonist opioid pharmacotherapy (e.g., buprenorphine), which can also be used to treat pain. Second, given that the committee did not have access to other sources of pharmacy data, such as from the DoD or other private payers (commercial, TRICARE, self-pay), there will be some uncertainty that the study 2 population were truly opioid naïve. However, with the available pharmacy data, the committee applied exclusion criteria to capture at best a truly opioid-naïve study population. Third, different approaches for estimating opioid dosages have been proposed in the literature, each with pros and cons (Dasgupta et al., 2021). The committee’s approach for measuring opioid dosages captures the average over time and does not indicate cumulative opioid exposure or exact dosages that preceded mortality. Fourth, as noted, the committee focused on dosage trajectories over a relatively short time span, which limits comparability to studies examining very high dosages (e.g., 100+ MME) or dosage differences occurring well into treatment (Dasgupta et al., 2021). The committee made these choices to adhere to TTE framework practices (e.g., new users). Fifth, given the application of G-formula, the share of risk attributable to the initial dosage versus the escalation trajectory, or the combined effect of these two aspects of treatment, could not be reported. Sixth, the number of suicide deaths precluded the ability to report results for the association of initial opioid dosages and escalation strategies with suicide mortality. Additionally,
the computing constraints and sample size within many subgroups also forestalled any subgroup and sensitivity analyses. Nonetheless, the reported risks, RRs, and confidence intervals still provide important information in response to the statement of task. It is evident from the findings that the risk for all-cause mortality increases with higher initial dosages and faster dosage escalation trajectories. Seventh, there is always the potential for residual confounding in an observational study, and the high amount of missing data on time-varying pain intensity ratings may contribute to missed measurement of key confounding variables. Lastly, the potential for positivity assumption15 violations cannot be ruled out because the committee used fairly strict dosage trajectory definitions and many covariates; therefore, the number of individuals with a given set of covariates and treatment patterns would be small. The committee sought to identify the causal effect of different dosage escalation strategies on mortality. A large number of potential dosage trajectories occur in practice, but treatment patterns were selected to ensure contrast between treatments and interpretability of results. Because of the wide array of actual trajectories, few individuals adhered strictly, and the inferences rely on some degree of extrapolation.
FINDINGS
The committee was tasked with quantifying the causal effect of different initial opioid dosage and escalation strategies on the risk of death among veterans who received care from the VHA between 2007–2019; the committee addressed this component of the statement of task using TTE. Study 2 addresses the objective outlined in part (b) of the statement of task, which is to examine “the effect of higher doses relative to lower doses of opioids.”
Finding 2a-1. Among veterans with newly dispensed opioid pharmacotherapy, the 12-month risk of all-cause mortality in each of the initial opioid dosage strategy was 3.95 percent for low, 4.89 percent for medium, and 5.80 percent for high. (RRmedium vs low: 1.24 [95% CI: 1.20–1.28] and RRhigh vs low: 1.47 [95% CI: 1.44–1.50]).
Finding 2a-2. Among veterans with newly dispensed opioid pharmacotherapy, the committee is unable to draw conclusions about the effect of those who received a high or medium initial daily opioid dosage level, compared to veterans with a low initial daily opioid dosage level on suicide mortality within 12 months of follow-up, due to the lower number of suicide deaths in the eligible population.
The estimated mortality risk ranged from 3.95 percent in the low dosage strategy to 5.80 percent in the high dosage strategy. The estimated RRs, using the low dose strategy as the reference, suggest that mortality rates were higher for the medium (1.24) and high dosage (1.47) strategies.
Finding 2b-1. Among veterans with newly dispensed opioid pharmacotherapy, the 12-month risk of all-cause mortality in each of the dosage escalation strategy was 2.70 percent for stable, 4.56 percent for slow, and 4.69 percent for fast over the first 6 months. (RRslow vs stable: 1.69 [95% CI: 1.53–1.89] and RRfast vs stable: 1.74 [95% CI: 1.57–1.94]).
Finding 2b-2. The committee is unable to draw conclusions about the effect of escalating dosages of opioid pharmacotherapy on suicide mortality within 12 months of follow-up, due to the lower number of suicide deaths in the eligible population.
CONCLUSIONS
The committee evaluated the effect of different opioid dosage strategies on all-cause mortality and suicide mortality. The committee employed the TTE framework to reduce biases, such as due to immortal time, and confounding. In addition, the committee leveraged the large observational datasets (e.g., health care, clinical, and
___________________
15 Positivity is an assumption that all types of individuals must have the possibility of following each treatment protocol. In this study, a violation could occur when some individuals are not observed to receive one of the dosage trajectories.
administrative data) available within the VA and VHA, supplemented by CMS data, and the NDI for mortality data. Based on the study findings, the committee makes the following conclusions for veterans who received care from the VHA between 2007–2019:
Conclusion 3. The committee concludes that there is an increased risk of all-cause mortality among veterans who initiated opioid treatment at higher dosage levels compared to lower levels.
Conclusion 4. The committee concludes that there is an increased risk of all-cause mortality among veterans whose treatment strategy was either slow or fast opioid dosage escalation compared to stable dosage.
Conclusion 8. Given the lower number of suicide deaths in the eligible population the committee is unable to conduct analyses to address the question of the effect of different opioid dosage treatment strategies on suicide mortality.
ANNEX: SUPPLEMENTARY FIGURES AND TABLES
| Covariate | % Missing |
|---|---|
| Sex | 0.00 |
| Age (Continuous) | 0.00 |
| Race | 9.79 |
| Ethnicity | 5.86 |
| Marital Status | 5.47 |
| Disability Status | 0.27 |
| History of homelessness (yes/no) | 0.00 |
| Tobacco Use Ever (Yes/No) | 0.00 |
| Health Conditions | |
| Physical Health Conditions | |
| Abdominal pain | 0.00 |
| Back Pain | 0.00 |
| Fibromyalgia | 0.00 |
| Fractures | 0.00 |
| Headaches | 0.00 |
| Limb Pain | 0.00 |
| Musculoskeletal Pain | 0.00 |
| Neck Pain | 0.00 |
| Neuropathy | 0.00 |
| Orofacial Pain | 0.00 |
| Systemic Disorders | 0.00 |
| Urogenital Pain | 0.00 |
| Other | 0.00 |
| AIDS/HIV | 0.00 |
| Blood Loss Anemia | 0.00 |
| Cardiovascular Disease | 0.00 |
| Cerebrovascular Disease | 0.00 |
| Chronic Lung Disease | 0.00 |
| Cirrhosis | 0.00 |
| COPD1 | 0.00 |
| Deficiency Anemia | 0.00 |
| Dementia | 0.00 |
| Diabetes | 0.00 |
| End Stage Renal Disease | 0.00 |
| Heart Disease | 0.00 |
| Hepatitis | 0.00 |
| Hemiplegia or Paraplegia | 0.00 |
| Liver Disease | 0.00 |
| Covariate | % Missing |
|---|---|
| Migraine | 0.00 |
| Peptic Ulcer Disease | 0.00 |
| Peripheral Vascular Disease | 0.00 |
| Pulmonary Circulation Disorders | 0.00 |
| Renal Disease | 0.00 |
| Rheumatic Disease | 0.00 |
| Syncope | 0.00 |
| Sleep Disorders | |
| Apnea | 0.00 |
| Insomnia | 0.00 |
| Mental Health | |
| Attention-Deficit/Hyperactivity Disorder | 0.00 |
| Alcohol Use Disorder | 0.00 |
| Anxiety | 0.00 |
| Bipolar Disorder | 0.00 |
| Depression | 0.00 |
| Drug Use Disorder | 0.00 |
| Opioid Overdose | 0.00 |
| Posttraumatic Stress Disorder | 0.00 |
| Schizophrenia and Psychosis | 0.00 |
| Suicidal Ideation | 0.00 |
| Traumatic Brain Injury | 0.00 |
| Average Pain Intensity Rating (in past month) | 29.97 |
| Body Mass Index | 7.64 |
| Health Care Coverage | |
| Supplemental Health Insurance to VHA Coverage | 0.03 |
| Medicare (ever/never) | 0.00 |
| Health Care Utilization in Past Year | |
| Number of VA2 Outpatient Visits | 0.00 |
| Inpatient Hospital Admission | 0.00 |
| Nursing Home Visit (Yes/No) | 0.00 |
| Military Status | |
| Service Era | 1.64 |
| Combat Service | 0.00 |
| Military Sexual Trauma | 2.25 |
| Military Branch | 14.87 |
| Prescription Information | |
| Opioid Formulation | |
| Any Long Acting | 0.00 |
| Benzo Co-Prescription (≥1 dispensed tablet during episode month) | 0.00 |
| Covariate | % Missing |
|---|---|
| Prescription Information (Rx3 dispensed within 90 days before baseline, Yes/No) | |
| Gabapentinoids | 0.00 |
| Anticonvulsant | |
| Carbamazepine | 0.00 |
| Oxcarbazepine | 0.00 |
| Topiramate | 0.00 |
| Antidepressant | 0.00 |
| Desvenlafaxine | 0.00 |
| Mirtazapine | 0.00 |
| Venlafaxine | 0.00 |
| Antihistamine | |
| Hydroxyzine | 0.00 |
| Anxiolytic | |
| Buspirone | 0.00 |
| Migraine Pharmacotherapy | 0.00 |
| Muscle Relaxers | 0.00 |
| Other Non-Opioid Analgesic | |
| Acetaminophen | 0.00 |
| Facility urbanicity | 15.88 |
1 COPD: Chronic obstructive pulmonary disease.
2 VA: Veterans Affairs.
3 Rx: Prescription.
NOTE: No cell sizes of 10 or less are included in the reported result.
REFERENCES
Baumblatt, J. A. G., C. Wiedeman, J. R. Dunn, W. Schaffner, L. J. Paulozzi, and T. F. Jones. 2014. High-risk use by patients prescribed opioids for pain and its role in overdose deaths. JAMA Internal Medicine 174(5):796-801.
Berna, C., R. J. Kulich, and J. P. Rathmell. 2015. Tapering long-term opioid therapy in chronic noncancer pain: Evidence and recommendations for everyday practice. Mayo Clinic Proceedings 90(6):828-842.
Binswanger, I. A., S. M. Shetterly, S. Xu, K. J. Narwaney, D. L. McClure, D. J. Rinehart, A. P. Nguyen, and J. M. Glanz. 2022. Opioid dose trajectories and associations with mortality, opioid use disorder, continued opioid therapy, and health plan disenrollment. JAMA Network Open 5(10):e2234671.
Bohnert, A. S., and M. A. Ilgen. 2019. Understanding links among opioid use, overdose, and suicide. New England Journal of Medicine 380(1):71-79.
Bohnert, A. S. B., M. A. Ilgen, S. Galea, J. F. McCarthy, and F. C. Blow. 2011a. Accidental poisoning mortality among patients in the Department of Veterans Affairs. Medical Care 49(4):393-396.
Bohnert, A. S. B., M. Valenstein, M. J. Bair, D. Ganoczy, J. F. McCarthy, M. A. Ilgen, and F. C. Blow. 2011b. Association between opioid prescribing patterns and opioid overdose-related deaths. JAMA 305(13):1315-1321.
Cahill, C. M., W. Walwyn, A. M. Taylor, A. A. Pradhan, and C. J. Evans. 2016. Allostatic mechanisms of opioid tolerance beyond desensitization and downregulation. Trends in Pharmacological Sciences 37(11):963-976.
CDC (Centers for Disease Control and Prevention). 2002. Instruction manual: Part 9. https://www.cdc.gov/nchs/data/dvs/im9_2002.pdf.pdf (accessed December 24, 2024).
Chihuri, S., and G. Li. 2019. Use of prescription opioids and initiation of fatal 2-vehicle crashes. JAMA Network Open 2(2):e188081.
Chung, B. C., G. J. Bouz, C. K. Mayfield, H. Nakata, A. B. Christ, D. A. Oakes, J. R. Lieberman, and N. D. Heckmann. 2021. Dose-dependent early postoperative opioid use is associated with periprosthetic joint infection and other complications in primary TJA. Journal of Bone and Joint Surgery American 103(16):1531-1542.
Coyle, D. T., C. Y. Pratt, J. Ocran-Appiah, A. A.-O. Secora, C. Kornegay, and J. Staffa. 2018. Opioid analgesic dose and the risk of misuse, overdose, and death: A narrative review. Pharmacoepidemiology and Drug Safety 27(5):464-472.
Dasgupta, N., M. J. Funk, S. Proescholdbell, A. Hirsch, K. M. Ribisl, and S. Marshall. 2016. Cohort study of the impact of high-dose opioid analgesics on overdose mortality. Pain Medicine 17(1):85-98.
Dasgupta, N., Y. Wang, J. Bae, A. C. Kinlaw, B. A. Chidgey, T. Cooper, and C. Delcher. 2021. Inches, centimeters, and yards: Overlooked definition choices inhibit interpretation of morphine equivalence. Clinical Journal of Pain 37(8):565-574.
Davidson, R., and J. G. MacKinnon. 2001. Bootstrap tests: How many bootstraps? Econometric Reviews 19(1):55-68.
Dowell, D., T. Haegerich, and R. Chou. 2019. No Shortcuts to Safer Opioid Prescribing. New England Journal of Medicine 380(24):2285-2287.
Dowell, D., K. R. Ragan, C. M. Jones, G. T. Baldwin, and R. Chou. 2022. Prescribing opioids for pain—the new CDC clinical practice guideline. Morbidity and Mortality Weekly Report 71(3):1–95.
Dunn, K. M., K. W. Saunders, C. M. Rutter, C. J. Banta-Green, J. O. Merrill, M. D. Sullivan, C. M. Weisner, M. J. Silverberg, C. I. Campbell, B. M. Psaty, and M. Von Korff. 2010. Overdose and prescribed opioids: Associations among chronic non-cancer pain patients. Annals of Internal Medicine 152(2):85-92.
FDA (Food and Drug Administration). 2022. FDA identifies harm reported from sudden discontinuation of opioid pain medicines and requires label changes to guide prescribers on gradual, individualized tapering. https://www.fda.gov/drugs/fda-drug-safety-podcasts/fda-identifies-harm-reported-sudden-discontinuation-opioid-pain-medicines-and-requires-label-changes (accessed August 14, 2024).
Forbes, K. 2011. Opioids in Cancer Pain. Edited by K. Forbes: Oxford University Press.
Frank, J. W., E. Carey, C. Nolan, R. D. Kerns, F. Sandbrink, R. Gallagher, and P. M. Ho. 2019. Increased nonopioid chronic pain treatment in the Veterans Health Administration, 2010–2016. Pain Medicine 20(5):869-877.
Gomes, T., M. M. Mamdani, I. A. Dhalla, J. M. Paterson, and D. N. Juurlink. 2011. Opioid dose and drug-related mortality in patients with nonmalignant pain. Archives of Internal Medicine 171(7):686-691.
Gomes, M., N. Latimer, M. Soares, S. Dias, G. Baio, N. Freemantle, D. Dawoud, A. Wailoo, and R. Grieve. 2022. Target trial emulation for transparent and robust estimation of treatment effects for health technology assessment using real-world data: Opportunities and challenges. Pharmacoeconomics 40(6):577-586.
Goulet, J. L., R. D. Kerns, M. Bair, W. C. Becker, P. Brennan, D. J. Burgess, C. M. Carroll, S. Dobscha, M. A. Driscoll, and B. T. Fenton. 2016. The musculoskeletal diagnosis cohort: Examining pain and pain care among veterans. Pain 157(8):1696-1703.
Hahn, J., Y. Jo, S. H. Yoo, J. Shin, Y. M. Yu, and Y. M. Ah. 2022. Risk of major adverse events associated with gabapentinoid and opioid combination therapy: A systematic review and meta-analysis. Frontiers in Pharmacology 13:1009950.
Hayes, C. J., E. E. Krebs, T. Hudson, J. Brown, C. Li, and B. C. Martin. 2020. Impact of opioid dose escalation on the development of substance use disorders, accidents, self-inflicted injuries, opioid overdoses and alcohol and non-opioid drug-related overdoses: A retrospective cohort study. Addiction 115(6):1098-1112.
Hayhurst, C. J., and M. E. Durieux. 2016. Differential opioid tolerance and opioid-induced hyperalgesia: A clinical reality. Anesthesiology 124(2):483-488.
Henry, S. G., B. L. Wilsey, J. Melnikow, and A.-M. Iosif. 2015. Dose escalation during the first year of long-term opioid therapy for chronic pain. Pain Medicine 16(4):733-744.
Hernán, M. A., and J. M. Robins. 2016. Using big data to emulate a target trial when a randomized trial is not available. American Journal of Epidemiology 183(8):758-764.
Hernán, M. A., B. C. Sauer, S. Hernandez-Diaz, R. Platt, and I. Shrier. 2016. Specifying a target trial prevents immortal time bias and other self-inflicted injuries in observational analyses. Journal of Clinical Epidemiology 79:70-75.
HHS (Department of Health and Human Services). 2020. CMS cell suppression policy. https://www.hhs.gov/guidance/document/cms-cell-suppression-policy (accessed December 20, 2024).
Hirsch, J., G. Nicola, G. McGinty, R. Liu, R. Barr, M. Chittle, and L. Manchikanti. 2016. ICD-10: History and context. American Journal of Neuroradiology 37(4):596-599.
Hser, Y.-I., A. J. Saxon, L. J. Mooney, K. Miotto, Y. Zhu, C. K. Yoo, D. Liang, D. Huang, and D. S. Bell. 2019. Escalating opioid dose is associated with mortality: A comparison of patients with and without opioid use disorder. Journal of Addiction Medicine 13(1):41-46.
Ilgen, M. A., K. Zivin, K. L. Austin, A. S. Bohnert, E. K. Czyz, M. Valenstein, and A. M. Kilbourne. 2010. Severe pain predicts greater likelihood of subsequent suicide. Suicide and Life-Threatening Behavior 40(6):597-608.
Ilgen, M. A., A. S. B. Bohnert, D. Ganoczy, M. J. Bair, J. F. McCarthy, and F. C. Blow. 2016. Opioid dose and risk of suicide. Pain 157(5):1079-1084.
Kaplovitch, E., T. Gomes, X. Camacho, I. A. Dhalla, M. M. Mamdani, and D. N. Juurlink. 2015. Sex differences in dose escalation and overdose death during chronic opioid therapy: A population-based cohort study. PLoS One 10(8):e0134550.
Li, G., and S. Chihuri. 2019. Prescription opioids, alcohol and fatal motor vehicle crashes: A population-based case-control study. Injury Epidemiology 6:11.
Liang, C., J. D. Seeger, and D. D. Dore. 2016. Implications of immortal person-time when outcomes are nonfatal. Annals of Epidemiology 26(3):212-217.
Logan, R. W., J. G. Young, S. Taubman, Y. Chiu, Lodi, S. Picciotto, G. Danaei, and M. A. Hernán. 2022. G-formula SAS Macro Version 4.0. https://github.com/CausalInference/GFORMULA-SAS (accessed October 24, 2023).
Lund, J. L., D. B. Richardson, and T. Stürmer. 2015. The active comparator, new user study design in pharmacoepidemiology: Historical foundations and contemporary application. Current Epidemiology Reports 2:221-228.
Magarbeh, L., I. Gorbovskaya, R. Wells, R. Jhirad, B. Le Foll, and D. J. Müller. 2023. Pharmacogenetics of lethal opioid overdose: Review of current evidence and preliminary results from a pilot study. Journal of Personalized Medicine 13(6):918.
Manchikanti, L., A. M. Kaye, N. N. Knezevic, H. McAnally, K. Slavin, A. M. Trescot, S. Blank, V. Pampati, S. Abdi, J. S. Grider, A. D. Kaye, K. N. Manchikanti, H. Cordner, C. G. Gharibo, M. E. Harned, S. L. Albers, S. Atluri, S. M. Aydin, S. Bakshi, R. L. Barkin, R. M. Benyamin, M. V. Boswell, R. M. Buenaventura, A. K. Calodney, D. L. Cedeno, S. Datta, T. R. Deer, B. Fellows, V. Galan, V. Grami, H. Hansen, S. Helm Ii, R. Justiz, D. Koyyalagunta, Y. Malla, A. Navani, K. H. Nouri, R. Pasupuleti, N. Sehgal, S. M. Silverman, T. T. Simopoulos, V. Singh, D. R. Solanki, P. S. Staats, R. Vallejo, B. W. Wargo, A. Watanabe, and J. A. Hirsch. 2017. Responsible, safe, and effective prescription of opioids for chronic non-cancer pain: American Society of Interventional Pain Physicians (ASIPP) guidelines. Pain Physician 20(2S):S3-S92.
McGrath, S., V. Lin, Z. Zhang, L. C. Petito, R. W. Logan, M. A. Hernan, and J. G. Young. 2020. G-formula: An R package for estimating the effects of sustained treatment strategies via the parametric G-formula. Patterns (N Y) 1(3).
Mercadante, S., E. Arcuri, and A. Santoni. 2019. Opioid-induced tolerance and hyperalgesia. CNS Drugs 33(10):943-955.
Morgan, M. M., and M. J. Christie. 2011. Analysis of opioid efficacy, tolerance, addiction and dependence from cell culture to human. British Journal of Pharmacology 164(4):1322-1334.
NASEM (National Academies of Sciences, Engineering and Medicine). 2019. An approach to evaluate the effects of concomitant prescribing of opioids and benzodiazepines on veteran deaths and suicides. Washington DC: National Academies Press.
NCHS (National Center for Health Statistics). 2023. Underlying cause of death 1999-2020. https://wonder.cdc.gov/wonder/help/ucd.html#Source (accessed August 24, 2024).
Nersesyan, H., and K. V. Slavin. 2007. Current approach to cancer pain management: Availability and implications of different treatment options. Therapeutics and Clinical Risk Management 3(3):381-400.
Oquendo, M. A., and N. D. Volkow. 2018. Strategies for reducing opioid-overdose deaths—Lessons from Canada. New England Journal of Medicine 378(17):1567-1569.
Park, T. W., R. Saitz, D. Ganoczy, M. A. Ilgen, and A. S. Bohnert. 2015. Benzodiazepine prescribing patterns and deaths from drug overdose among U.S. veterans receiving opioid analgesics: Case-cohort study. BMJ 350:h2698.
Racine, M. 2018. Chronic pain and suicide risk: A comprehensive review. Progress in Neuro-Psychopharmacology and Biological Psychiatry 87:269-280.
Ray, W. A. 2003. Evaluating medication effects outside of clinical trials: New-user designs. American Journal of Epidemiology 158(9):915-920.
Salas, J., J. F. Scherrer, F. D. Schneider, M. D. Sullivan, K. K. Bucholz, T. Burroughs, L. A. Copeland, B. K. Ahmedani, and P. J. Lustman. 2017. New-onset depression following stable, slow, and rapid rate of prescription opioid dose escalation. Pain 158(2):306-312.
Sandbrink, F., E. M. Oliva, T. L. McMullen, A. R. Aylor, M. A. Harvey, M. L. Christopher, F. Cunningham, T. Minegishi, T. Emmendorfer, and J. M. Perry. 2020. Opioid prescribing and opioid risk mitigation strategies in the Veterans Health Administration. Journal of General Internal Medicine 35(Supplement 3):927-934.
Sandbrink, F., J. L. Murphy, M. Johansson, J. L. Olson, E. Edens, J. Clinton-Lont, J. Sall, C. Spevak, and VA/DoD Guideline Development Group. 2023. The use of opioids in the management of chronic pain: Synopsis of the 2022 updated U.S. Department of Veterans Affairs and U.S. Department of Defense clinical practice guideline. Annals of Internal Medicine 176(3):388-397.
Santosa, K. B., Y. L. Lai, C. M. Brummett, J. D. Oliver, H. M. Hu, M. J. Englesbe, E. M. Blair, and J. F. Waljee. 2020. Higher amounts of opioids filled after surgery increase risk of serious falls and fall-related injuries among older adults. Journal of General Internal Medicine 35(10):2917-2924.
Sarchiapone, M., L. Mandelli, M. Iosue, C. Andrisano, and A. Roy. 2011. Controlling access to suicide means. International Journal of Environmental Research Public Health 8(12):4550-4562.
Schneeweiss, S., J. A. Rassen, J. S. Brown, K. J. Rothman, L. Happe, P. Arlett, G. Dal Pan, W. Goettsch, W. Murk, and S. V. Wang. 2019. Graphical depiction of longitudinal study designs in health care databases. Annals of Internal Medicine 170(6):398-406.
Song, I.-A., H.-R. Choi, and T. K. Oh. 2022. Long-term opioid use and mortality in patients with chronic non-cancer pain: Ten-year follow-up study in South Korea from 2010 through 2019. EClinicalMedicine 51.
Sung, M. L., S. K. Eden, W. C. Becker, S. Crystal, M. S. Duncan, K. S. Gordon, R. D. Kerns, S. Kundu, M. Freiberg, and K. A. So-Armah. 2024. The association of prescribed opioids and incident cardiovascular disease. Journal of Pain 25(5):104436.
Turner, B. J., and Y. Liang. 2015. Drug overdose in a retrospective cohort with non-cancer pain treated with opioids, antidepressants, and/or sedative-hypnotics: Interactions with mental health disorders. Journal of General Internal Medicine 30:1081-1096.
VA (Department of Veterans Affairs). 2019. VA/DoD clinical practice guideline for the management of chronic insomnia disorder and obstructive sleep apnea. Washington, DC: U.S. Department of Veterans Affairs.
VA/DoD (Department of Defense). 2003. VA/DoD Clinical Practice Guideline for the Management of Opioid Therapy for Chronic Pain. Washington, DC: U.S. Department of Veterans Affairs, Department of Defense.
VA/DoD. 2010. VA/DoD clinical practice guideline: Management of opioid therapy for chronic pain. Washington, DC: U.S. Department of Veterans Affairs, Department of Defense.
VA/DoD. 2017. VA/DoD clinical practice guidelines for opioid therapy for chronic pain. Washington, DC: U.S. Department of Veterans Affairs, Department of Defense.
VA/DoD. 2022. VA/DoD clinical practice guideline for the use of opioids in the management of chronic pain. Washington, DC: U.S. Department of Veterans Affairs, Department of Defense.
VHA (Veterans Health Administration). 2006. Outpatient pharmacy services—VHA Handbook 1108.05. https://www.vendorportal.ecms.va.gov/FBODocumentServer/DocumentServer.aspx?DocumentId=1508282&FileName=VA246-14-Q-0798-008.pdf (accessed November 11, 2024).
Weiner, S. G., S. El Ibrahimi, M. A. Hendricks, S. E. Hallvik, C. Hildebran, M. A. Fischer, R. D. Weiss, E. W. Boyer, P. W. Kreiner, D. A. Wright, D. P. Flores, and G. A. Ritter. 2022. Factors associated with opioid overdose after an initial opioid prescription. JAMA Netw Open 5(1):e2145691.


